
Overview
On 19 March 2026, the Australian Energy Regulator (AER) released its Draft Default Market Offer (DMO) determination for the 2026–27 regulatory year. The Draft DMO proposes electricity price reductions across all DMO regions (NSW, Southeast QLD, SA). The DMO establishes a regulated price cap for standing offer electricity plans and serves as a benchmark reference price for market offers. It is designed to provide a safety net for households and small business customers who do not actively switch electricity retailers.
Under the Draft determination, residential customers are forecast to experience annual price reductions of between 1.3% and 10.1%, while small business customers could see larger reductions ranging from 7.6% to 21.2%, depending on region and distribution network. These reductions are primarily driven by lower wholesale electricity costs (WEC).
Wholesale Electricity Costs and DMO Methodology
Wholesale electricity costs are a key component of the DMO and are calculated using a complex methodology. In simplified terms, the WEC reflects a volume-weighted average of ASX Energy contract prices. As WEC typically represents approximately 30–40% of the final DMO, changes in forward contract prices can materially influence regulated electricity prices.
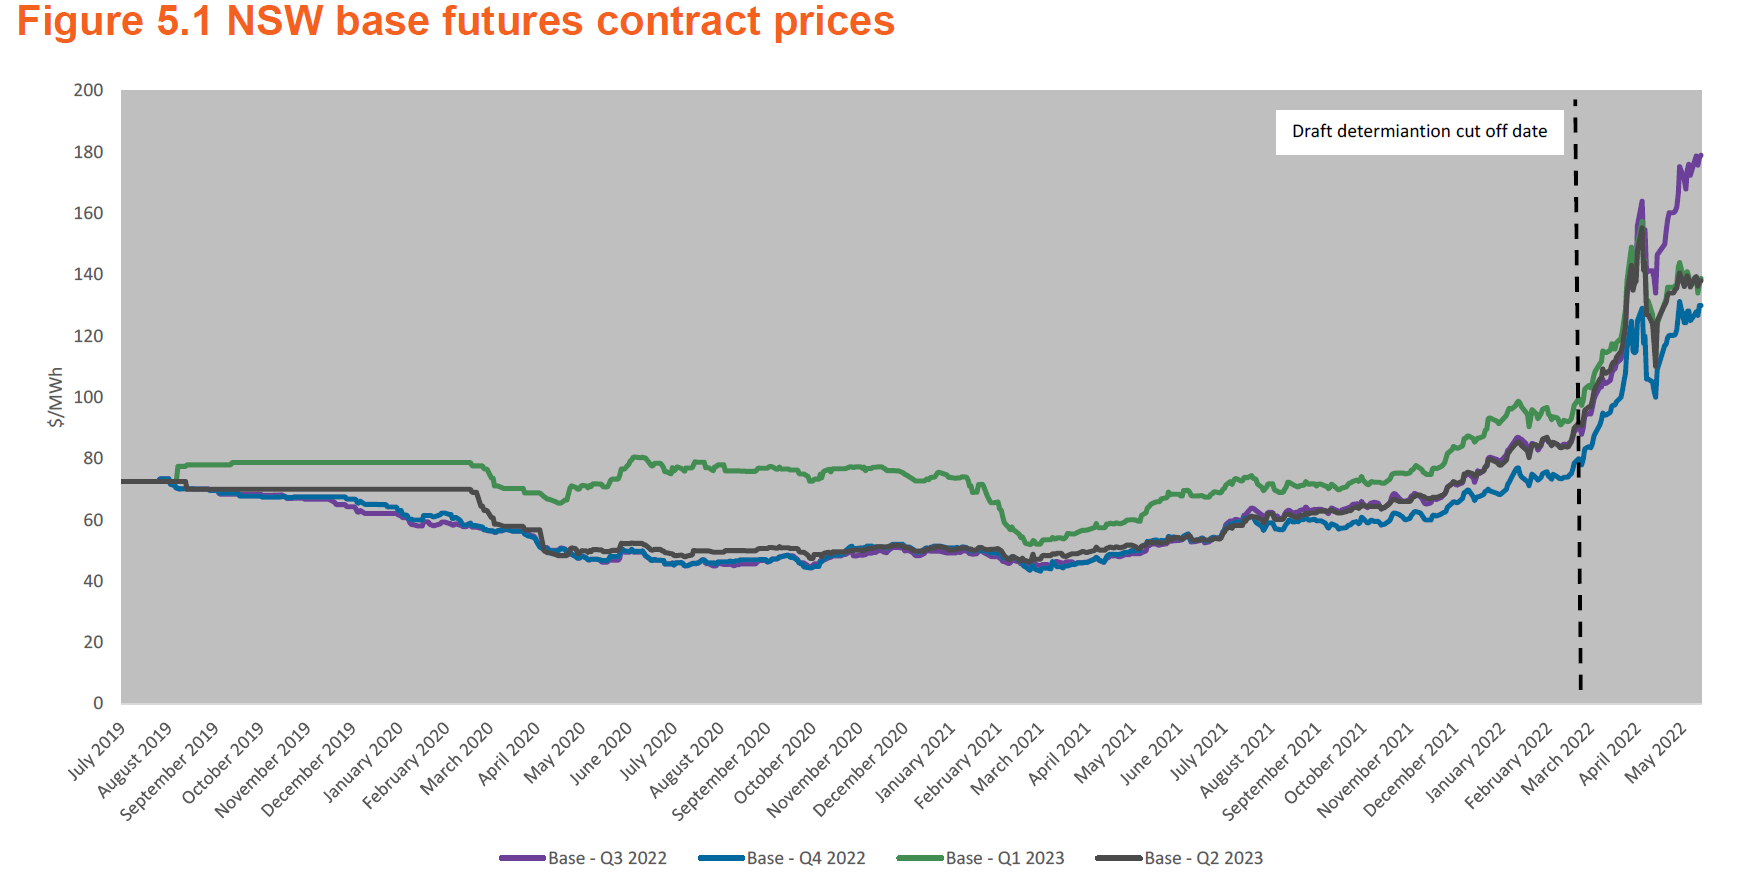
Lessons from the 2022 DMO Volatility
Historical experience demonstrates the sensitivity of the DMO to rapid changes in energy contract prices. In 2022, a sharp increase in futures contract prices—approximately 100% between the Draft DMO release in February and the Final DMO determination in May—was largely triggered by the war in Ukraine. This resulted in a significant uplift in WEC, with increases of ~25% in QLD and NSW, and ~5% in SA.
The table below illustrates the extent of these changes in 2022 for flat-rate tariffs across key distribution networks:
| Distribution Network | Draft WEC ($/MWh) | Final WEC ($/MWh) | Change |
| Ausgrid | 97.94 | 122.23 | 25% |
| Endeavour | 98.94 | 124.25 | 26% |
| Essential | 91.53 | 115.97 | 27% |
| Energex | 92.47 | 110.53 | 20% |
| SAPN | 128.26 | 134.53 | 5% |
Current Market Conditions and the Iran Conflict
Baseload quarterly contracts for FY27 remained broadly stable throughout most of 2025 and declined steadily between November 2025 and February 2026. However, following the US–Iran conflict on 28 February 2026, contract prices across these three states have increased by ~10–20%.
This development raises the question of whether current geopolitical tensions could result in a similar divergence between the Draft and Final DMO outcomes as observed in 2022.
Expected Impact on the Final 2026–27 DMO
Analysis conducted by Edge2020, drawing on historical Draft versus Final DMO outcomes and movements in contract prices, suggests that if forward prices for FY27 remain at current levels, the impact on the Final DMO is likely to be minimal.
In a more extreme scenario—where contract prices rise rapidly over the next two months in a manner comparable to 2022—the WEC component could increase by up to 7%. However, such an outcome is considered highly unlikely due to stronger coal fleet availability, softer fuel prices, and increased renewable generation and storage capacity in the market. Even in this scenario, the overall impact on final DMO prices would be moderated, given the partial contribution of WEC to total DMO costs.
Longer-Term Implications
While the immediate impact on the 2026–27 Final DMO is expected to be limited, sustained higher forward contract prices would eventually feed into future DMO determinations. As a result, prolonged geopolitical instability and persistently elevated energy prices could place upward pressure on regulated electricity prices in subsequent years.


