We’re all about providing a tailored and specialised service to our clients. But we also know you often need quick access to information regarding your energy consumption and spend. This is why we’ve developed Edge Live.
Edge Live is a secure, online information portal that gives you instant access to contracts, portfolio information, reports, data and so much more. The portal provides you with instant access to the information you need to make informed choices for your business.
Our latest enhancements to the Edge Live software is our interactive Dashboard module.
Interactive Dashboards
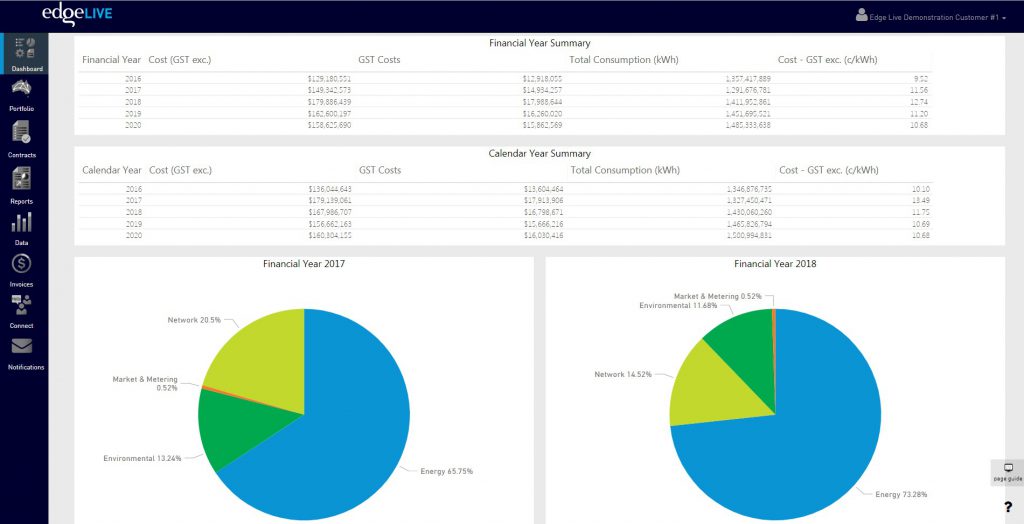
Edge Dashboard provides you with an interactive graphical portal that allows you to view your consumption and energy costs across a chosen period. The functionality of the dashboard allows you to filter data to a specific financial or calendar year, whilst also providing you with the ability to set your own date range.
Figure 1 Cost data being displayed by financial and calendar year both in table and graphical format.
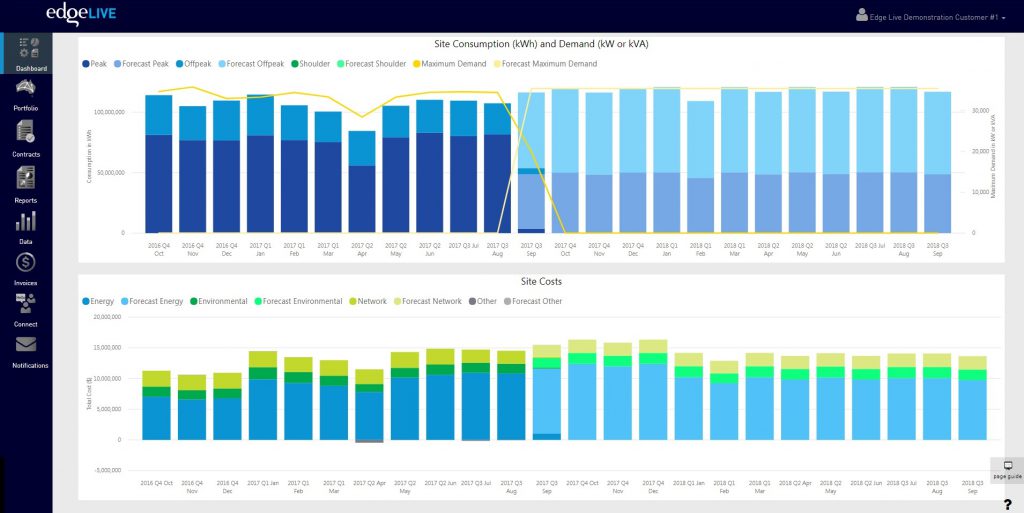
It also provides you with the ability to drill down to specific sites and/or regions, depending on the portfolio or type of reporting that you wish to obtain information for.
Figure 2 Graph illustrating site consumption and demand across a period of months and a graph illustrating site costs across a period of months.
If you require more information than the standard dashboard provides, bespoke dashboards can be prepared for you in conjunction with our in-house IT Team and your dedicated Portfolio Manager.
Other Interactive Modules
Edge live has many modules that will provide you with valuable data and information that is critical to managing your energy portfolio. These modules include:
- Counterparty contracts;
- Portfolio information;
- Reports, and
- Data.
To read more about Edge Live functionality click here, and call your Portfolio Manager on 07 3905 9220 to book in a demonstration.

