Overview of National Electricity Market (NEM) Quarter 3 2022
International drivers continue to increase gas and electricity prices across the NEM. The main reason for this increase has been and continues to be the tight supply / demand balance resulting from Gas flow restriction in Europe, associated with the war in Ukraine. The reduced flow of gas in Europe has resulted in a greater demand for Australian gas that in turn has put cost pressures on Australian gas market. Higher priced gas then links into to Australian electricity market, leading to higher spot and futures electricity prices.
For Q322 electricity spot prices averaged $216/MWh across the (NEM). The Q322 average spot price of electricity was close to matching the all time record of $264/MWh that occurred in Q222. Interestingly, the average price of electricity for Q322 was more than three times higher than the same quarter the previous year. In Q321the average price of electricity was $58/MWh.
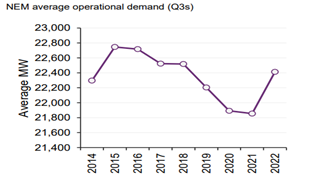
NEM operational demand increased by 2.6% or 559MW to 22,414 MW compared with the same quarter last year. We also saw demand increase for the first time in Q3 since 2015. Households and businesses used more electricity from the grid as a result of their underlying electricity consumption increasing and the output from their rooftop Photovoltaic systems (PV) not generating as much as normal due to cloudy conditions.
High spot prices occurred at the start of Q322 on the back of record high spot prices seen across Q222. The July NEM monthly average of $360/MWh was $23/MWh higher than the June 2022 average of $337/MWh. Later on in the quarter spot prices fell with August Electricity prices averaging $145/MWh across the NEM. Until this year QLD, NSW, VIC and TAS have not recorded a Q3 average electricity price of over $100/MWh. South Australia reached this milestone in Q316 at $119/MWh.
Historically Q3 is not a volatile quarter, but this year it is different, Q322 saw 24% of the dispatch intervals with a price over $300/MWh. This is on the back of the previous quarter, in July prices exceeded $300/MWh 61% of the time, the highest monthly proportion since the start of NEM. Many intervals saw prices in the $300-$500/MWh range resulting in spot prices moving above the historical price cap threshold of $300/MWh.
Below are the drivers that elevated spot prices and volatility in Q322.
- A reliance on thermal generation (coal and gas fired) with higher fuel cost due to the increased demand for these resources internationally.
- Hydro generation setting prices at elevated levels due to limited water supply and bids adjusted to meet revised trading strategies.
- An increase in demand as consumption increased and rooftop PV generation reduced due to cloudy skies.
- Price volatility significantly increased the average spot price of electricity with large jumps in spot price due to the distribution of generation offers within the bid stack. The market operator stacks all offers from lowest to highest to build the bid stack. The spot price for a trading interval is the offer price of the marginal unit at the required generation level to meet demand. The bid stack ranges from -$1,000 to $15,500/MWh. During August the spot price reached over $1,000/MWh as generators withdrew generation for technical and economic reasons.
- With higher average electricity prices we also saw less negative electricity prices across the NEM. In the previous year we experienced negative prices 17% of the time but for Q3 we have only experienced negative prices 9% of the time.
Weather
A La Niña event was declared across the NEM increasing the likelihood of above average winter-spring rainfall across much of northern and eastern Australia, while a negative Indian Ocean Dipole (IOD) event increased the likelihood of rainfall across southern and eastern Australia. Q322 was very wet, with many sites recording their wettest July on record. Wet weather continued across Q3 with September’s rainfall being the fifth highest on record across Australia. Temperatures at the beginning of the quarter were below average in many parts of Victoria and Tasmania and above average minimum temperatures occurred across south-east Australia.
La Niña resulted in wet and cloudy conditions impacting solar generation and the supply of coal to power stations, in additon to the export market resulting in higher prices.
Electricity Demand
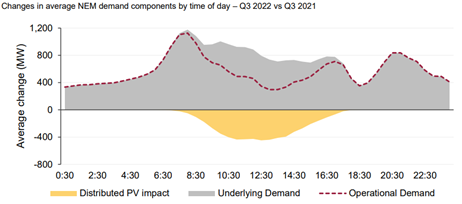
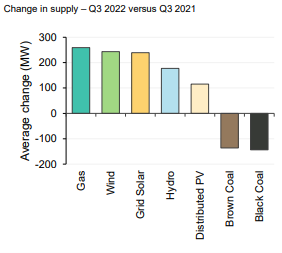
As outlined above the NEM demand has changed since the same time last year, the below chart shows this graphically.
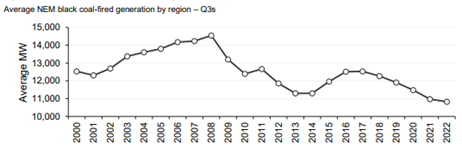
The chart below shows how the demand in Q3 has increased in recent years.
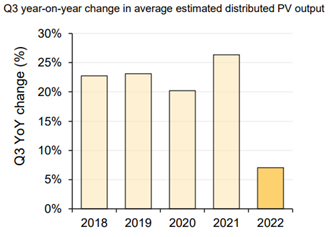
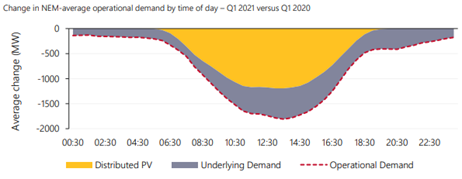
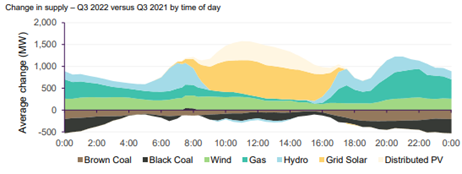
The charts below also show the slow down in the growth on rooftop PV and change in operational demand.
NEM Spot Prices
NEM spot prices have increased significantly and have reached unprecedented levels.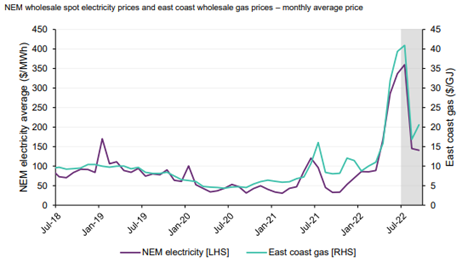
The cost of the underlying fuels for generators has led to these increases. Coal and gas prices are at all time highs due to international demands leading to a high cost of generation. The chart shows the correlation between East coast gas price and the price of electricity. Coal also corelated closely to the cost of generation and a resulting electricity spot price.
Prices have also increased as renewables generation (solar, wind and hydro) is lower due to cloud cover reducing solar, low storage levels reducing hydro generation and hence it bids in at higher prices. There have also been large swings in the output from wind which results in spot market volatility.
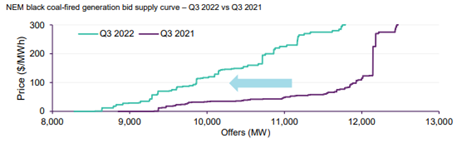
Generation and Offer Prices
Gas contributed the most to supply in Q322 and as result of the high cost of gas this has influenced the average spot price.The lower volume of generation from coal was a result of bidding behaviour withdrawing thermal capacity and intermittent generation like solar and wind taking a larger market share.
A lower capacity factor for coal generation has resulted in coal fired availability moving higher up the bid stack resulting in coal fired generation needing to dispatch at higher spot prices to meet their long run average costs.
Emissions
NEM emissions intensities declined this quarter slightly to 0.6 tCO2-e/MWh. Total emissions were 0.2% lower than Q321.
Australian Stock Exchange (ASX)
The futures market was influenced by a higher spot market, gas prices and the delays experienced with large scale renewables, a slowing in the rooftop PV market and climate conditions likely to reduce the output from solar generation.
The future price of electricity traded on the ASX for Calendar 2023 (Cal 23) continued to increase in price across the quarter in the four NEM mainland regions. Cal 23 New South Wales futures finished the quarter at $232/MWh, with Queensland at $224/MWh, South Australia at $193/MWh and Victoria at $157/MWh.
Credits: All charts in this report are sourced from AEMO
Edge 2020 offer market leading services for business energy users who require a resource they can trust. We help you navigate the ever-changing energy landscape and ensure the proactive and accurate delivery of advisory, account, and portfolio management services and associated outcomes. Reach out, we would love to assist you: info@edge2020.com.au or call on:1800 334 336