Background
The average spot price for the QLD region on Saturday 14 January 2017 was $1,472.95/MWh. 2017 had already seen warm weather and an increasing volatility before Saturday however this was the first day where the 24 hour period averaged more than $1,000/MWh. This report will explore some of the reasons for the high prices on this day.
Temperature and demand
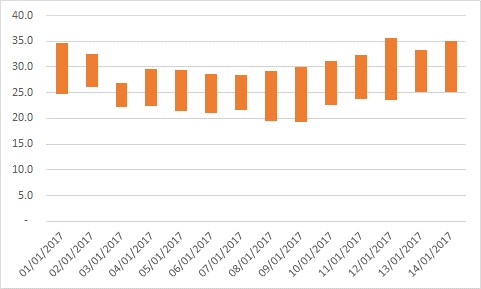
Temperatures for January have been above average in general. The lowest maximum temperature recorded so far this month has been 26.8 degrees on Tuesday 3 January 2017.This was followed by the highest maximum so far of 35.6 degrees on Thursday 12 January. Saturday 14 January had a maximum temperature of 35.0 degrees in Brisbane.
Figure 1: Minimum and Maximum Temperatures for Brisbane
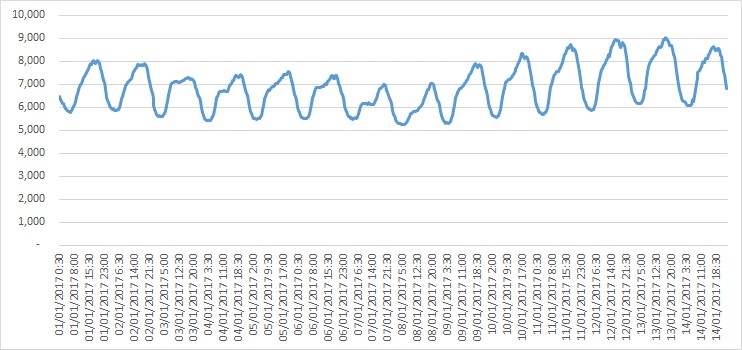
The increase in demand started as soon as the maximum temperatures were above 30 degrees. This also coincided with more people returning to work and putting more pressure on air conditioned load in office buildings. Normally we would expect to see a reduction in demand on weekends but demand on Saturday 14 January was as high as many of the previous working week days.
Figure 2: QLD regional demand
The sustained period of heat meant that residential customers were turning their air conditioners on as soon as it got warm, or even leaving them on overnight. With minimum temperatures remaining around 25 degrees, it was warm from the start of the day creating a large air conditioned load during the day. The humidity levels accompanying these high temperatures also mean air conditioners require more electricity for cooling. There was a fair amount of solar PV contribution but by 6:30 PM this had largely all fallen away.
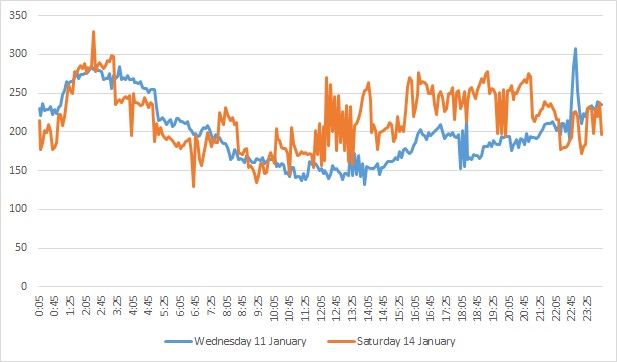
Demand for the day looked more like a working week day. In fact, it looked almost identical to the demand profile of the previous Wednesday (11 January 2017).
Figure 3: QLD demand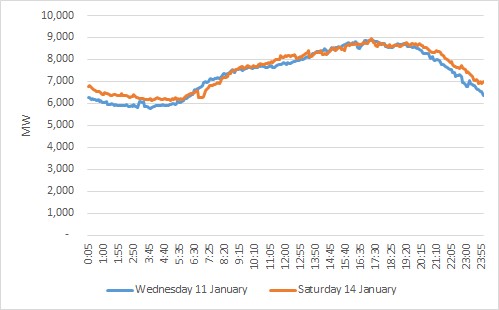
The price had been high on the Wednesday at $166.49/MWh but this was still a lot less than the $1,472.95/MWh experienced on the Saturday.
Interconnector
It was only Queensland which experienced unusually high prices. Prices In all other regions in the NEM were within the expected range for January.
Figure 4: Average NEM prices 14 January 2017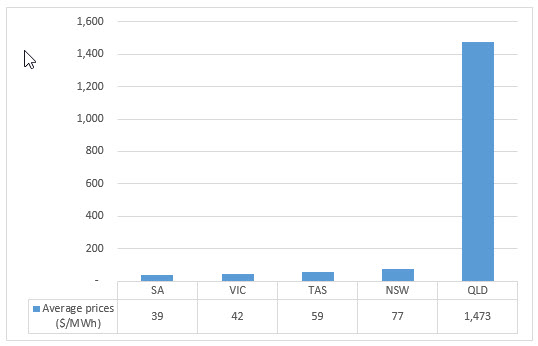
A study of the main interconnector between QLD and NSW shows that it was at times affected by lightning activity and de-rated due to heat. As part of normal operation it is also reduced by an amount which means that QLD can lose its largest generating unit (usually Kogan Creek Power Station). With Kogan Creek Power Station generating near capacity for most of the day, the interconnector was reduced.
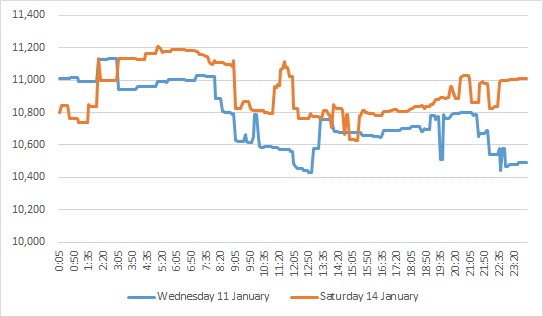
Figure 5: Flow limit from NSW into QLD on main interconnector
The interconnector limits are somewhat optimised with load and prices which is why we see it moving around a lot on high priced days. Overall, the interconnector performed similar (or even slightly better) on Saturday than Wednesday.
The interconnector played a role but it was not the main difference on the day.
Available generation
QLD is one of the few states which still enjoys sufficient generation. The two year outlook produced by the market operator consistently shows there are no expected situations where generation is unable to meet demand even during high temperatures.
Figure 6: Available generation
Available generation on Saturday was very similar to Wednesday and there were no material changes to the mix of generators available (coal / gas / hydro etc).
Price setters
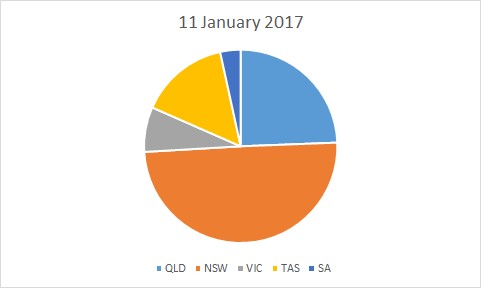
The market clears by every generator receiving the price of the lowest priced bid which can satisfy demand. There was a change in the price setter on Saturday compared with previous days. Using Wednesday 11 January to contrast we can see a number of differences.
Figure 7: Price setters by region
 |
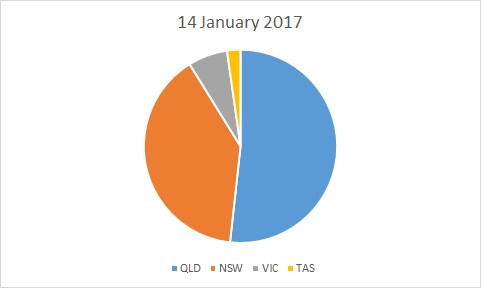 |
On 14 January more than half of all spot prices were set locally in QLD compared to less than 25% on 11 January. The prices set locally were much higher than the prices set interstate.
If we look at the technology type we can also see that coal dominated the market on 14 January displacing other sources, in particularly Hydro. With the higher prices it was easier for peaking plant (distillate and diesel) to dispatch setting prices more often.
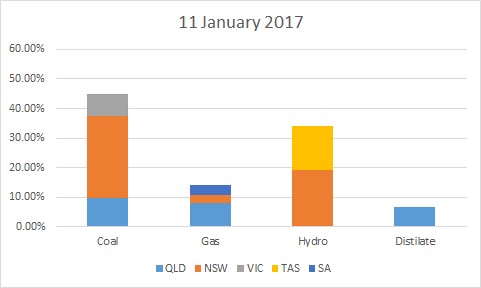 |
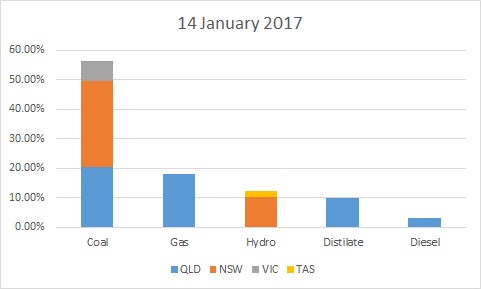 |
Most of the prices (56%) were still set by coal which has a modest running cost. The fuel mix on its own doesn’t explain the higher prices unless we look at the actual behaviour on the day.
Bidding behaviour
For most participants there is a trade-off between price and dispatch. The more volume is bid in low price band, the higher the dispatch volume but also the lower the price and vice versa. Generally what we see is participants covering their contract position by bidding in at the cost of generation and then competing for dispatch, market share and prices above this.
Most of the participants in QLD seemed to have the same bidding strategy on Saturday as they had adopted the entire month. Only Stanwell and InterGen seemed to have changed their approach on the day [1]
[1] A number of other participants changed their bids, these were mainly intermediate or high priced (peaking) plant. It is typical behaviour for them to rebid if the prices unexpectedly are high
Figure 8: Stanwell bidding and dispatch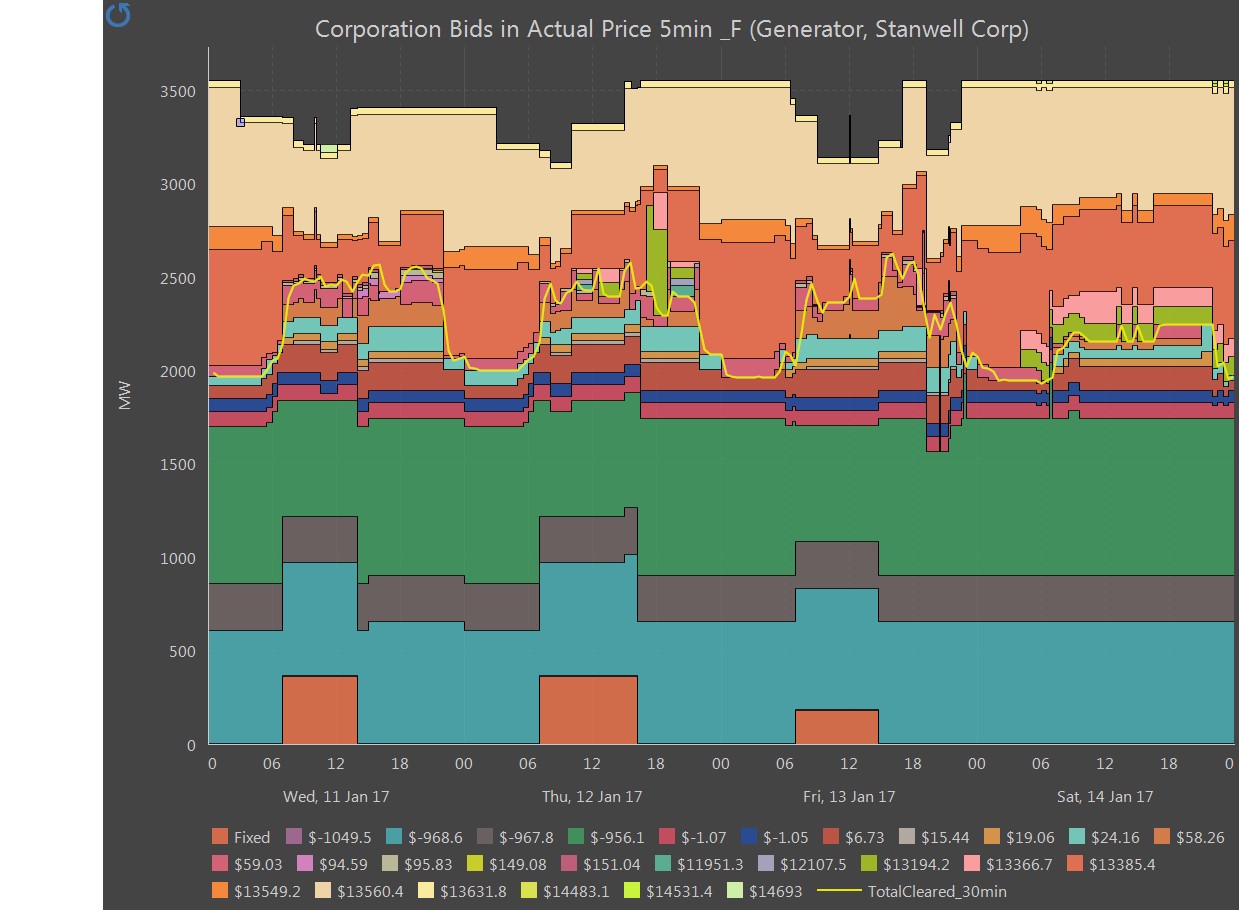
On Wednesday 11 January Stanwell provided ~2,500 MW at prices less than $60/MWh. On Saturday 14 January they had changed their bids so they were only offering ~2,200 MW at this bid band. During the day, Stanwell rebid their four Tarong Power Station units saying that demand was higher than originally expected, the prices were different than expected or that a peaking plant (Mt Stuart) had come on line. On all occasions, Stanwell moved volume from cheaper price bands to higher price bands making higher prices more likely.
The only other QLD generator which made less volume available was InterGen who reduced their available generation to 670 MW on Saturday compared with 760 MW on Wednesday.
Figure 9: InterGen bidding and dispatch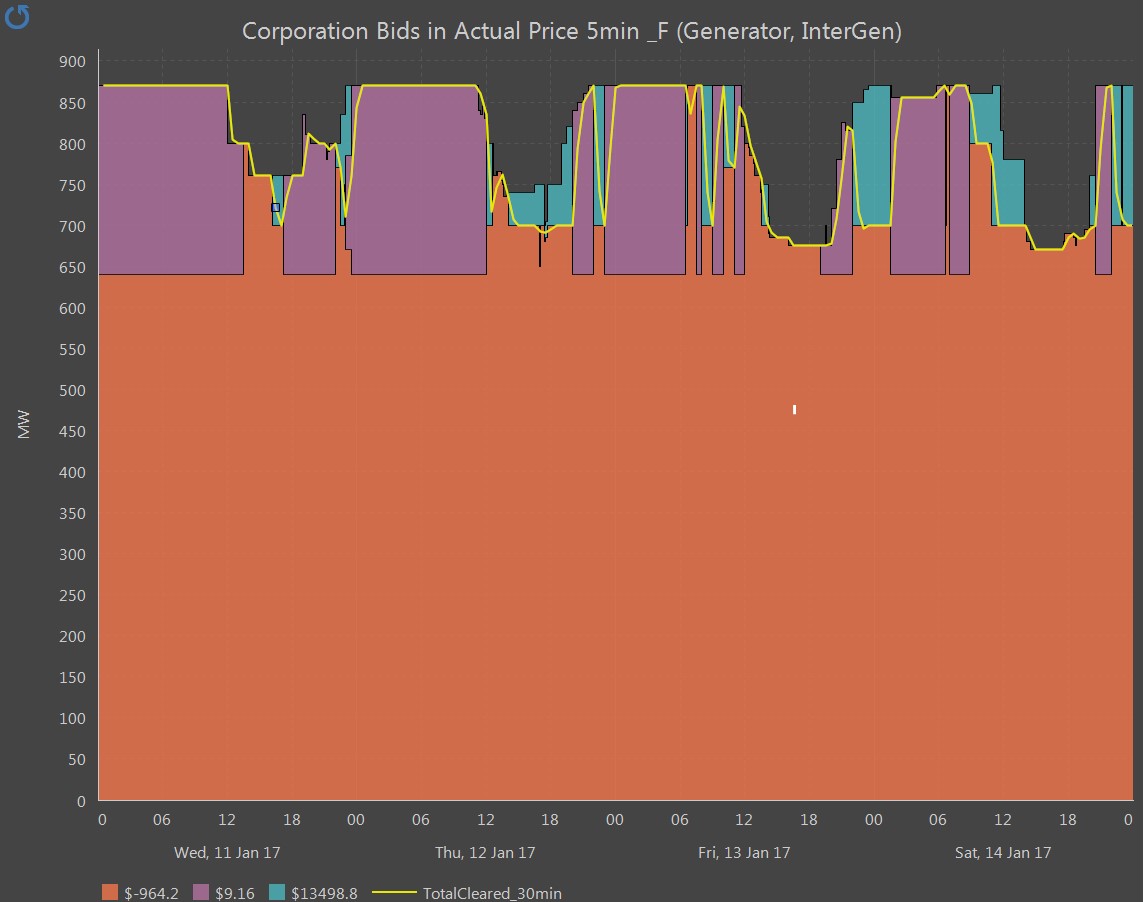
InterGen owns the coal fired Millmerran Power Station which has two units. There were a few problems with the station on the day with baghouse issues (differential pressure was too high) and steam purification for reuse. There were also a number of rebids which related to the headroom on the main interconnector being lower than expected and the prices being higher. InterGen used this as an opportunity to put more volume in higher bid bands. It must be said that when the first spike occurred in the morning, InterGen added cheap volume to have maximum possible dispatch. They did not do so for subsequent price spikes.
It should be noted for absolute clarity that as far as Edge is aware, all bids (including initial offers and rebids) were made within the market rules. If there had been more competition in the state, others could have bid in their volume to be dispatched ahead of Stanwell and InterGen. This competition would mean that the prices may not have increased and both Stanwell and InterGen would have lost out on dispatch.
Will Q1 2017 continue to see high prices in QLD?
Prices were already high, but increased on Saturday 14 January 2017. With warm weather bringing high demand there is an opportunity for participants in QLD to reduce their output and increase prices when the interconnector is at capacity.
The only real difference between Wednesday and Saturday is that Saturday is an off-peak period and Stanwell could have a different contract position during off-peak. This means that it may be more profitable for Stanwell to reduce generation and increase prices during off-peak. This could continue throughout the quarter. It is worth noting that the main competitor (CS Energy) didn’t decrease their generation. Stanwell would not want to lose market share to its main competitor and may therefore not be as inclined to remove generation in future periods as this could mean surrendering market share.
