A new market notice within the National Electricity Market (NEM) posted by the Australian Energy Market Operator (AEMO), one we have not see before was issued to all market participants on the 23/12/19. The market notice requested and served as a reminder for all semi-scheduled and intermittent non-scheduled generators to ensure they update their market availability bids, update their SCADA Local Limit or, if unavailable, advise AEMO control room to implement a quick constraint to the reduced available capacity level; and update intermittent generation availability in the EMMS Portal to reflect reduced plant availability as is required under the National Electricity Rules (NER), per NER 3.7B(b).limits.
This was an interesting constraint for AEMO to issue as it was due to extreme heatwave conditions across the south east coast of Australia, and as with most generating plant, under extreme heat, some form of derating on its physical capacity and output can occur. On the 23/12/19 AEMO’s weather service provider was forecasting extreme high ambient temperatures across all NEM regions, hence AEMO’s market notice to these participants to remind semi-scheduled and intermittent non-scheduled generators to advise AEMO of any reduction in available capacity caused by temperature derating.
Particularly interesting is that the often “set and forget” approach to renewable generators such as solar and wind generators, as classified by AEMO as semi-scheduled generation is being watched with greater scrutiny, particularly after the events of 2016 in SA where a state wide blackout was triggered by a severe weather, damaging more than 20 towers, downing major transmission lines, and with multiple wind farms currently shouldering some of the blame for the state going black due to the wind farms switching off when the transmission lines went down.
Semi-scheduled: A generating system with intermittent output (like a wind or solar farm), and an aggregate nameplate capacity of 30 MW or more is normally classified as a semi-scheduled generator unless AEMO approves its classification as a scheduled generating unit or a non-scheduled generating unit. AEMO can limit a semi-scheduled generator’s output in response to network constraints, but at other times the generator can supply up to its maximum registered capacity (AEMO 2014).
If you have any questions regarding this article or the electricity market in general, call Edge on 07 3905 9220 or 1800 334 336.
Alex Driscoll, Manager Wholesale Clients and Markets
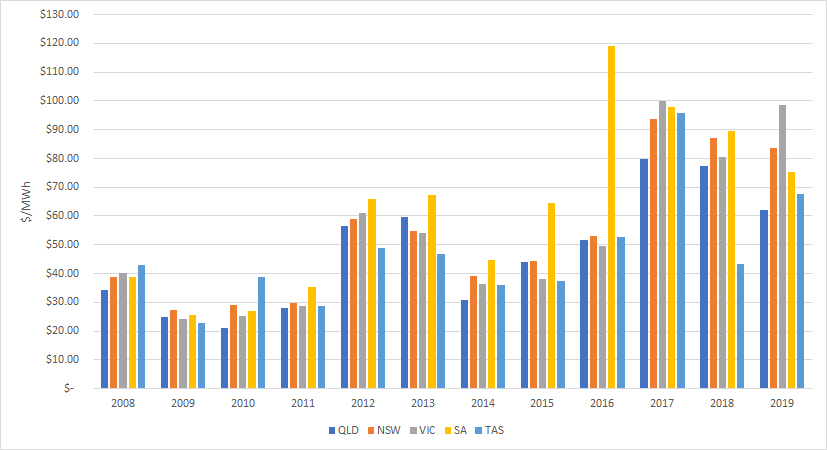
Electricity spot prices in Q319 (July to September) were relatively in line with Q3 2017 and 2018, however much higher than prices seen from 2014 to 2016 inclusive. Although, Q319 prices were softer than any other quarter for the year (2019) in majority of the NEM regions. The past three months have seen multiple negative price events in SA and QLD due to mild demand, constrained interconnectors and strong renewable generation volumes in solar (rooftop PV and large scale) and wind.
SA’s Q319 price is on a downward trajectory from the massive jump-up it experienced in 2016, taking with it NSW and QLD which both had lower Q319’s in comparison to the last 2 years. Whilst VIC and Tasmania’s Q319 regained in price post a slump in Q318.
Figure 1: Historical prices for autumn
(Source: AEMO)
Throughout Q319 both QLD and SA experienced multiple negative price events and settlement periods. These events in QLD were lead by a combination of transmission line works on the QNI restricting its flow into NSW, low demand, strong solar rooftop PV and large-scale solar generation and interesting bidding behavior by QLD thermal generation.. Fuelling the low and negative price events was market participant bidding behaviour. It can be seen in the bid stacks, that around mid-August 2019, Stanwell Corp shifted an additional ~500 MW of generation to a bid band of < $0/MWh, leaving a good 3,000 MW exposed to prices less than $0/MWh. On a mild demand day in QLD with strong Rooftop PV, operational demand is lucky to reach 5,000 MW; add QNI in at 1,000 MW and the result is Stanwell bidding half of QLD demand + QNI at below $0/MWh.
SA’s multiple negative price events were also due to transmission line constraints restricting flows into VIC, and soft operational demand which was impacted significantly by strong solar rooftop PV and strong wind generation figures with an average volume of 600 MW. There were multiple weekends which resulted in several hours per day of negative pricing with Friday the 27th of September resulting in ~11.5 hours of negative half hourly pricing. The strong wind generation levels also meant AEMO had to issue directions to Pelican Point and Osborne gas fired power stations multiple times throughout the quarter for grid stability.
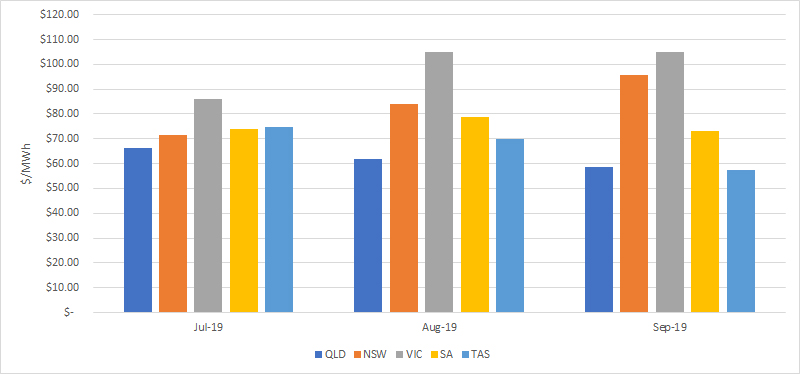
VIC and NSW prices across Q319 were both lifted by the Basslink outage which occurred on the 24th of August and lasted through to the 29th of September, resulting in no flows across the Basslink interconnector in either direction. During this time, VIC was heavily reliant on megawatts from NSW particularly during periods of low wind generation, whilst both regions were struggling with ailing baseload thermal plant issues and maintenance which was planned for the yearly shoulder period. The flip side of this? Tas was spared from the high price spikes experienced in VIC during this time which lead to a softened Q3 and September spot price for the region.
Figure 2: Average monthly spot prices in the NEM
(Source: AEMO)
Water levels at Snowy Hydro continued to increase at Lake Eucumbene over the quarter with levels now sitting at ~28.81 %, which is above the levels recorded the same time last year. The increased inflow of water volumes lead to a higher spill rate from Snow Hydro at Tumut, Upper Tumut (both NSW) and Murray (VIC) hydro plants. Additionally, issues with baseload thermal plant particularly in NSW and VIC lead to multiple gas peaking plants running to cover generation gaps at a higher price (due to higher cost of fuel).
Tas Hydro was able to conserve a fair amount of water in their dams over the period of the Basslink outage with storage volumes higher than they were a year prior, leading into the warmer months and Summer of 2019/2020.
With the increase in invoked constraints in QLD both inter and intra-regionally, QLD’s experienced 2 x five-minute VoLL spikes on the morning Wednesday 25th September. These VoLL spikes of $14,000/MWh and $13,998/MWh however were not so much due to market participant bidding or reflective of a market supply and demand squeeze, rather they were caused by both inter and intra-regional transmission constraints and limits imposed by AEMO. Transmission work was being carried out on lines impacting the QNI, forcing it to flow into NSW, whilst the QLD Central to Southern constraint was imposed, winding back generation north of Gladstone and Calvale. This meant that there was not sufficient enough generation in central QLD to satisfy demand, resulting in the bid stack climbing to $14,000/MWh to trigger multiple gas peakers and Wivenhoe who all reside south of Gladstone.
Also in this quarter we saw the release of AEMO’s 2019 ESOO which called out some imminent concerns for Summer:
Forecasted tightly balanced supply and demand in several regions heading into Summer 2019/20, with VIC the only region forecasting an elevated risk of expected unserved energy (USE) currently not exceeding the 0.002% threshold (at 0.0026%).
Potential risk to Summer 2019/20 if the Loy Yang A2 and Mortlake 2 remain on outage during the Summer period; AEMO are predicting 60% chance VIC’s Mortlake won’t be back for Summer 2020 and 30% AGL’s Loy Yang A2 won’t be back in time either.
AEMO currently working to secure the maximum permissible reserves via the Reliability and Emergency Reserve Trader (RERT) to ensure Victoria’s reliability of supply meets the reliability standard for this summer.
The above lead to a rally in the futures curves particularly in Q419 and Q120 in VIC, SA, NSW and Tas. These are all regions that would feel the pinch of tightly balanced supply and demand with thermal baseload plant in the two major regions, NSW and VIC currently experiencing reliability issues. At this stage, MTPASA and market intel depicts that both Loy Yang A2 and Mortlake 2 will be online mid to late December 2019 just in time for Summer.
Looking Forward:
Figure 3: Calendar year 2020 forward contracts
$/MWh
NSW
QLD
SA
VIC
TAS
08-Oct-19
$ 88.81
$ 72.67
$ 99.90
$ 103.09
$ 98.13
(Source: ASX)
The BoM is predicting a warmer than average Spring/Summer which should transpose to greater demand. This in turn could result in a greater need for supply generally resulting in higher spot prices. This should mean when the sun is beaming in QLD and the wind is howling in SA that the price should remain relatively high, enticing the generators to produce electricity and green certificates which have been a hot commodity in Q319. Despite this, NSW and VIC thermal plant are currently underway preparing for summer in what is generally coined their “summer readiness plan” utilising the shoulder period of the year to prepare plant for the warmer months. Transmission line work is likely to cease as we head into Spring/Summer also.
If you would like to discuss the electricity market outlook and potential impact to your electricity portfolio, please contact our Manager Wholesale Clients and Markets, Alex Driscoll on 07 3905 9220.
Alex Driscoll, Manager Wholesale Clients and Markets
Solar generation and its impact on spot price is a topic of major discussion, particularly in the ‘Sunshine State’ of Queensland where there is a continuous pipeline of solar generation development. This raises the question: is strong solar generation having an impact on spot prices, and if so, is it lowering or increasing prices?
Increasing Large-scale Solar Penetration in the NEM
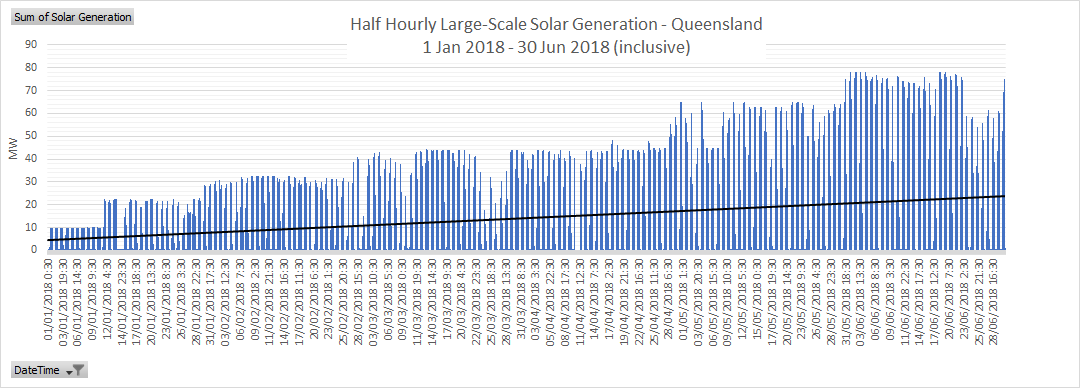
It is no secret that solar generation has increased dramatically over the last 12-18 months. From 1 January 2018 to 30 June 2018 (inclusive) the average daily production of large-scale solar generation in Queensland was only approximately 14.2 MW, only accounting for 0.085% of total Queensland generation.
(Source: AEMO)
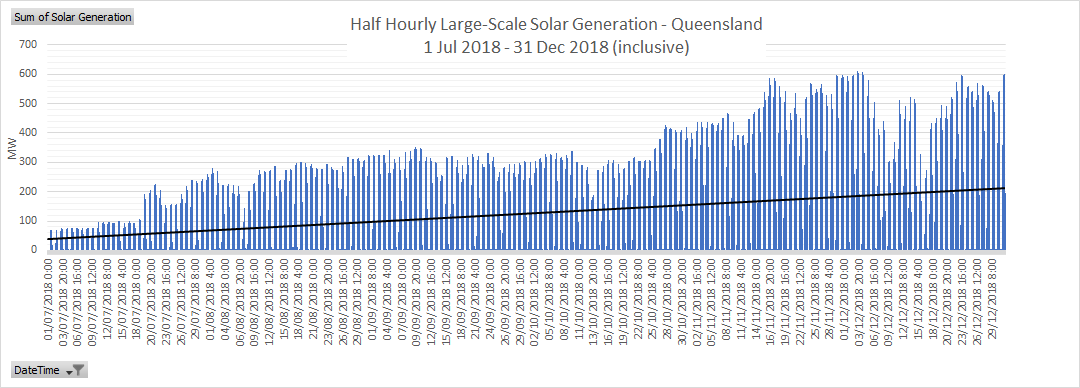
For the six months between 1 July 2018 to 31 December 2018 (inclusive), the average daily production of large-scale solar generation in Queensland increased to 125.3 MW and accounted for 1.9% (an increase of > 1% on the previous 6 months) of total Queensland generation during that period.
(Source: AEMO)
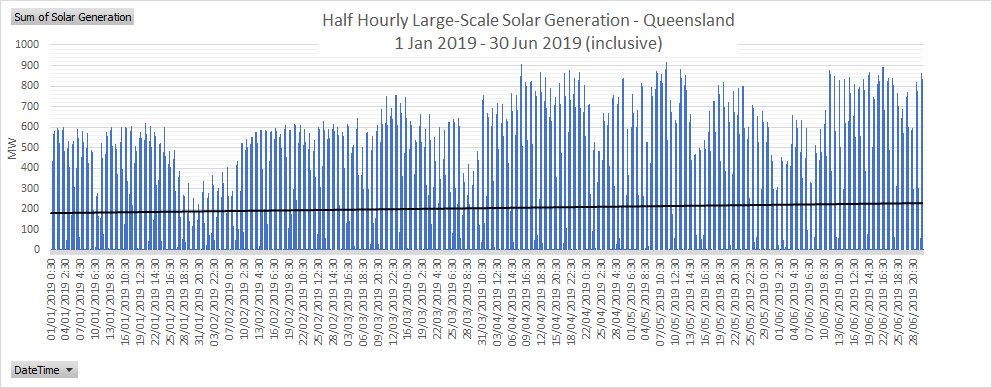
Fast forward to 2019, and generation volumes from large-scale solar generators has continued to increase, reaching a maximum of 917 MW on 08/05/2019 at 11:30. From 1 January 2019 to 30 June 2019 (inclusive) the average daily production of large-scale solar generation in Queensland increased to 205.6 MW and accounted for 3% (an increase of an additional 1% on the previous 6 months) of total Queensland generation.
(Source: AEMO)
The Rooftop (Photovoltaic) Reckoning
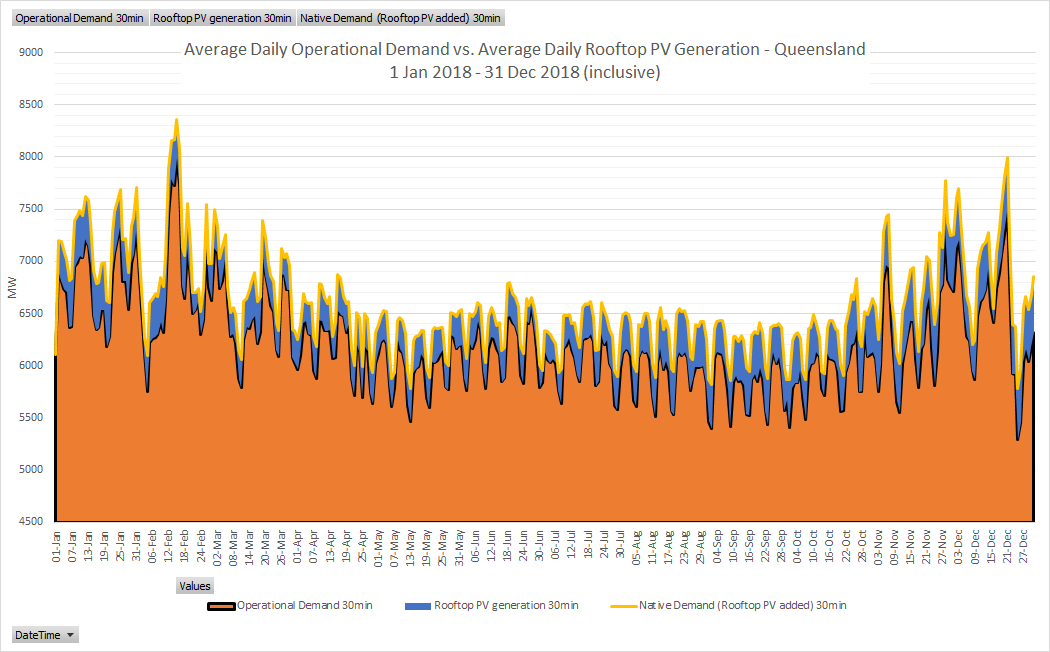
So far, we have only evaluated large-scale generation and its penetration in Queensland, however there is another solar photovoltaic beast infiltrating the NEM, namely Rooftop PV (small-scale home and business installations). If we look at similar timelines, home and business owners are deciding to take more control of where their energy comes from, with multiple household and business rooftops opting to install solar panels on what would be wasted space (and opportunity). It is important to understand, rooftop PV falls within AEMO’s (Australian Energy Market Operator) category of distributed energy resources which is subtracted from native demand to determine operational demand.
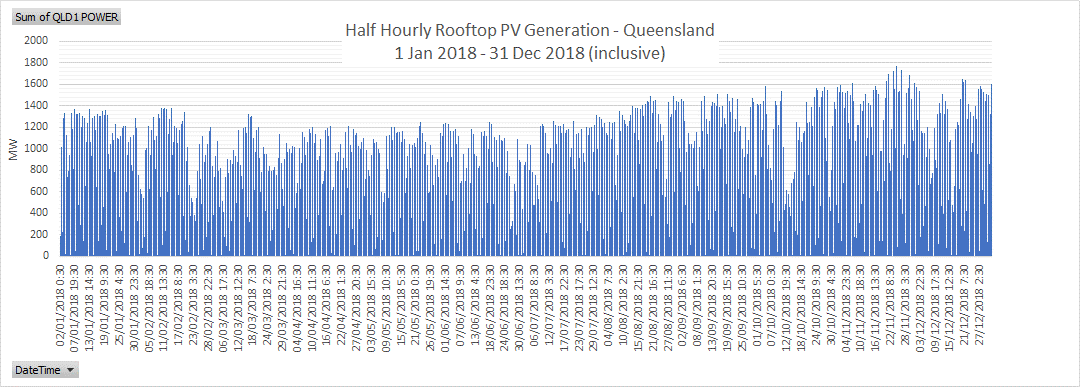
The general trend for rooftop PV is that its contribution to the energy mix is growing constantly. The maximum volume between 1 January 2018 to 30 June 2018 (inclusive) reached 1.4 GW, with the period 1 July 2018 to 31 December 2018 (inclusive) recording a maximum of 1.78 GW. That is an increase of almost 400 MW in six months. On average, rooftop PV reduced native Queensland demand by 345 MW each day on 30-minute demand figures across the entire 2018 Calendar Year.
(Source: AEMO)
(Source: AEMO)
Roughly year-to-date, we have not seen the same strong performance from rooftop PV. However, summer 2020 could provide a new rooftop PV maximum for Queensland and NEM wide with the Australian Photovoltaic Institute recording on average for the period of 1 January 2019 to 31 March 2019 (inclusive), an additional 16,200 reported installations.
(Australian PV Institute Solar Map, funded by the Australian Renewable Energy Agency, accessed from pv-map.apvi.org.au on 4 July 2019)
Impact to Spot Price
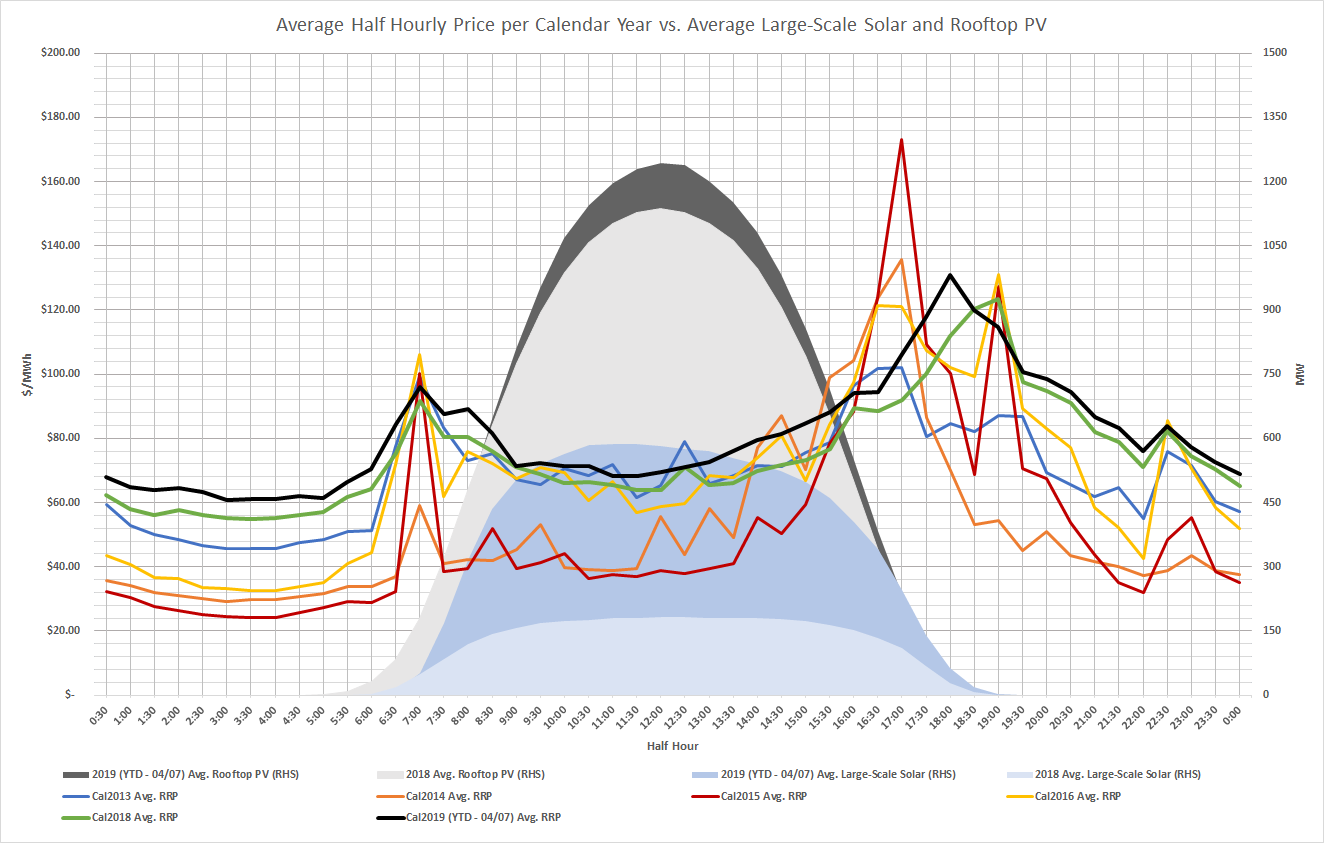
As the graph below depicts the calendar year, daily average half hourly pricing from 2013 to YTD 2019 (excluding 2017 as an outlier with bidding direction from Queensland government to GOCs). Despite the growth and increase in both average (half-hourly) rooftop PV and large-scale solar generation, spot prices have also increased. This is not to say that solar is to blame for the increase in prices, as price has not increased in all hours of the day.
To summarise the changes:
The morning peak has remained roughly the same across the years with a sharper ramp-up depicted in earlier years.
Evening peak has shifted further into the evening than earlier years depicted and is not as strong.
The off-peak hours have become increasingly more valuable in comparison to earlier years.
However, the biggest and possibly strangest movement is the daylight hour prices, or solar hours have roughly remained the same (apart from 2014/15).
(Source: AEMO)
We cannot conclusively say that the increase in solar generation is the sole reason for prices heading on an upward trajectory since 2014 (as the table below depicts), however it would be fair to say the increase in solar has played a part in it. The addition of the strong solar penetration has changed the dynamic of the market, causing thermal generators and other fuel types to re-think how they will recover the costs of their 15, 20, 30-year investments. Thermal generators will likely start by displacing the price curve and increasing bids in the off-peak periods. The evidence is clear in that the off-peak periods are now increasingly more valuable than they were 3-6 years ago.
On top of this, a large portion of solar generation is being built north of the Calvale and Wurdong substations in Queensland and is having little effect (unless new infrastructure is built) on middle of the day spot prices. This is due to contingent and operational constraints placed on the power lines by AEMO so as to not overload the lines, forcing generation north of this constraint (solar inclusive) to constrain off. Nonetheless, there are a multitude of factors impacting the price in Queensland and solar generation’s impact on prices should not be overlooked. However, one thing is for certain, spot prices have been increasing since 2014 (see below table) and in the near term show little sign of slowing.
Calendar Year ($/MWh)
QLD
2013
2014
2015
2016
2018
2019 YTD
Avg Spot Price
$ 68.41
$ 50.91
$ 51.96
$ 67.32
$ 74.82
$ 80.64
(Source: AEMO)
If you would like further information on the impact of solar generation, please contact your Manager Wholesale Clients or Edge on (07) 3905 9220.