The role of Mount Piper

At Mount Piper Power Station, a coal power station near Lithgow in NSW, operators work to minimise financial losses by reducing the units minimum operational load at which the units can stay online, as electricity prices plummet into negative territory during solar hours, driven by an influx of solar generation flooding the grid. They focus on positioning the station to capitalise on the expected price spike later in the day, as solar generation declines and supply tightens, leading to higher prices.

The plant, which has a total capacity of 1430 MW, can still operate a little over 10% capacity. While it was initially able to ramp down to only 320 MW, its minimum operating level was reduced to 150 MW in July 2023. This approach enables the unit to operate at a reduced load during the day – despite incurring losses, before ramping up production during the evening peak to offset earlier deficits and achieve profitability. “It’s a balancing act – how hard do they need us to get out of the way [of cheap renewable energy] versus how hard do they need us in the evening,” said Steve Marshall, Head of Mount Piper for EnergyAustralia.

With a capacity of 1430 MW, the power station’s two turbines supply about 10% of NSW’s maximum demand.

Mount Piper was instrumental during two significant grid events throughout 2024: the pre-summer heatwave in late November and the administered pricing event in May, where blackouts were narrowly averted. During these critical periods, the station operated at full capacity. Without Mount Piper’s contribution, load shedding in parts of NSW would likely have been inevitable.

Mount Piper has proven to be a reliable and critical unit in the state, experiencing minimal unplanned outages or trips compared to other units in the NEM.

Mount Piper Power Station has also explored ways to better manage the impact of solar carveouts, trialling a process called ‘two-shifting.’ This involves taking one steam turbine off the grid for up to 12 hours while keeping the boiler warm and ready for a quick restart. This approach has been adopted in other regions, such as the United Kingdom and United States, where plants have adapted to different daily cycles. However, operating the units in this manner is expensive, as they require upgrades and/or increased maintenance.

Several coal units across the NEM have struck agreements with the government to ensure supply capacity remains available until their planned exit from the grid.

  • Yallourn Generator (VIC): Secured by a 2021 agreement with the state government, ensuring 1480MW capacity until mid-2028.
  • Loy Yang A Generator (VIC): Similar agreement extending operation until 2035.
  • Eraring Plant (NSW): Agreement with NSW government extends operation to August 2027, adding two more years, with the option for a further two years without subsidies at this stage.

Mount Piper Power Station plans to play a “reserve” role, functioning as a firming unit that runs only when necessary to fill gaps in wind and solar generation. For several years, the station has participated in discussions with the NSW government about a potential industry-wide coal closure plan. A bill to establish a framework for the “orderly exit management” of coal power plants was passed by South Australian parliament on Wednesday, 27 November 2024, though the rules are still being finalised.

Mount Piper’s low minimum running output and two-shifting capability position the station as a valuable asset in the energy transition. However, maintaining the flexibility comes at a considerable cost. A major maintenance overhaul, scheduled to commence in April 2025, will require an investment of $160 million. During this period, Unit 1 will be offline from April 1 to May 26, and Unit 2 from April 6 to April 27, resulting in a 21-day overlap when both units will be out of service.

Edge2020 anticipates Mount Piper Power Station to play an increasingly crucial role in the transition as new clean generation and transmission projects come online. Given the station’s growing financial challenges amid negative prices, volatile market demand, and stricter environmental and regulatory requirements, this shift will require significant policy support by government.
Increased Trading Volume of Electricity Options

Over the past 6 years, there has been a surge in trading volume of electricity options. Drivers for the increase can be primarily attributed to the increased presence of speculative trading firms within the electricity market attempting to manage and capitalise on the volatility within the market. Options are also becoming an increasingly popular tool in the electricity space given the increase in Power Purchase Agreements (PPAs) being underwritten by these products. In doing so, companies are hedging against potential downside movements in the market to become more risk averse.

This trend highlights a strategic shift towards using financial instruments to manage electricity positions and mitigate risks associated with these long-term contracts. However, the volume traded in May 2024 for FY25 options expiry indicates a deceleration in trading volumes.

Interestingly, the dynamics of the options market are similar in the larger states of the NEM: Queensland, New South Wales, and Victoria. However, this contrasts significantly with South Australia, where the volume of options traded is much more in line with the volume of Futures traded. Overall, the futures and options market in South Australia is highly illiquid, with trading volumes declining over recent years. With the recent Q1 in SA being under RRO conditions and therefore fully contracted, the likely need to have exposed positions underpinned in the state has reduced and with it the appetite for speculators in the market. This contrasts with the other NEM states whose interconnector flows allow for cross-border spreads to be contracted and the opportunity for speculators to take advantage of these financial products without the requirement to physically settle their positions.

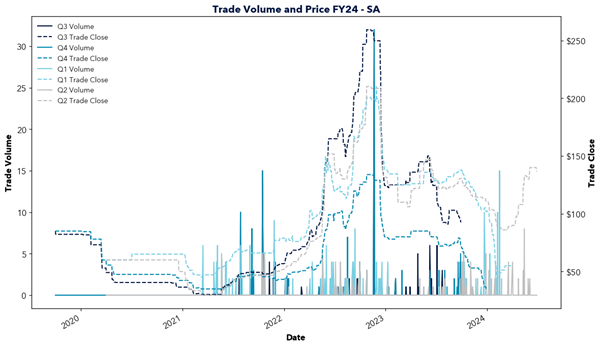
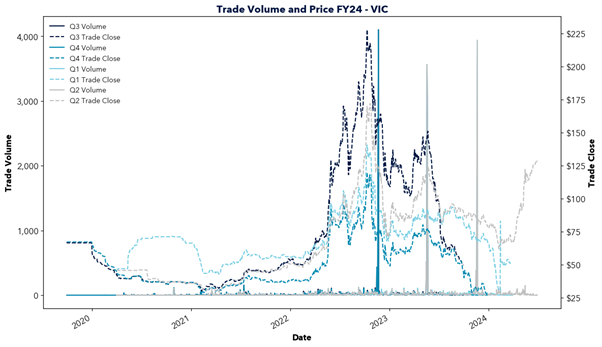
Electricity options are primarily traded in financial year (FY) and calendar year (CAL) strips, expiring in May (for FY) and November (for CAL) each year. Significant spikes can be observed in the following graphs for Queensland, New South Wales, and Victoria. The first four graphs illustrate a rising trend in trade volume over time, followed by a noticeable decline in the most recent expiry in May. The subsequent four graphs (graphs 5-8) overlay the FY24 quarter’s price and volume, highlighting the timing of expiries and their potential impact on prices.

With the CAL products coming towards expiry in November and high prices remaining in the ASX Swap market, this will likely lead to many of these products being exercised at expiry due to the strike price likely being below the current forward price. This can lead to increased volatility on the ASX over these periods and significant volume being traded. What will add a level of interest in this particular expiry period will be the low generation availability in NSW at the time of expiry. With many units already on outage schedules, any unplanned outages on the system could further exacerbate the price and add a level of fear and uncertainty to the market.

Graph 1 – NSW Trade Volume

Graph 2 – QLD Trade Volume


Graph 3 – SA Trade Volume

Graph 4 – VIC Trade Volume

Graph 5 – NSW FY24 Trade Volume & Price

Graph 6 – QLD FY24 Trade Volume & Price

Graph 7 – SA FY24 Trade Volume & Price

Graph 8 – VIC FY24 Trade Volume & Price

Are there seasonal trends in the FCAS market?

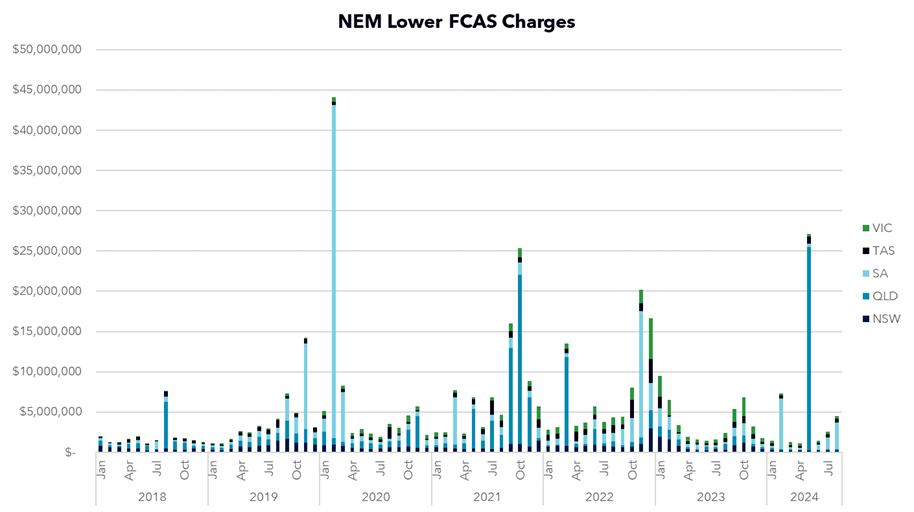
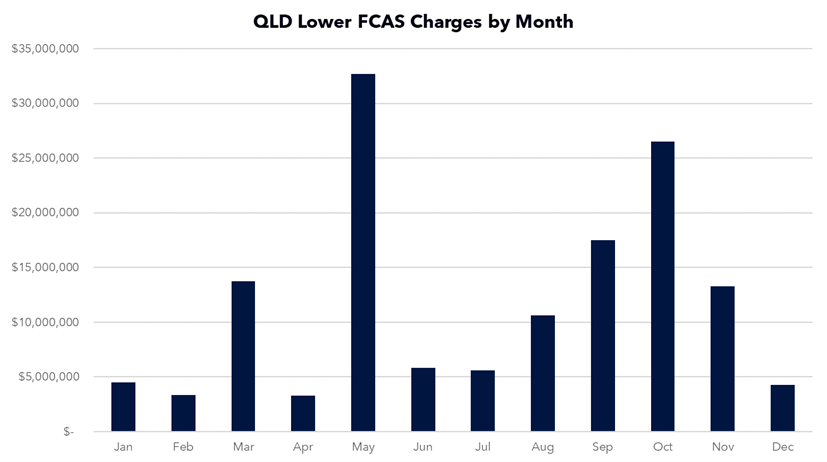
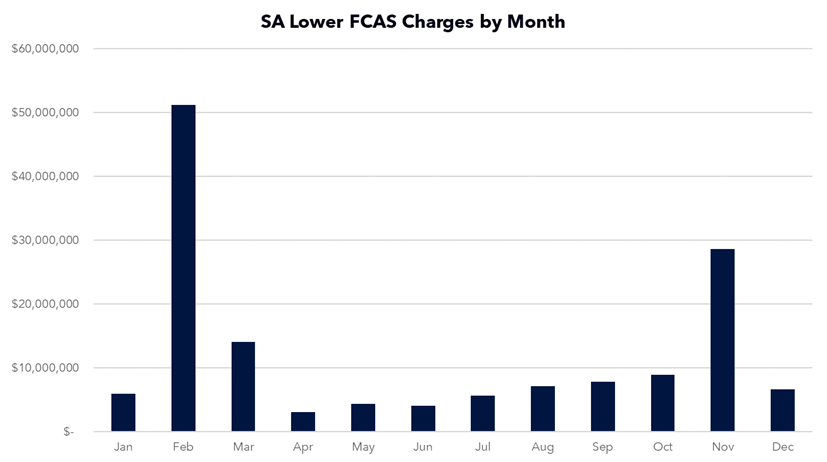
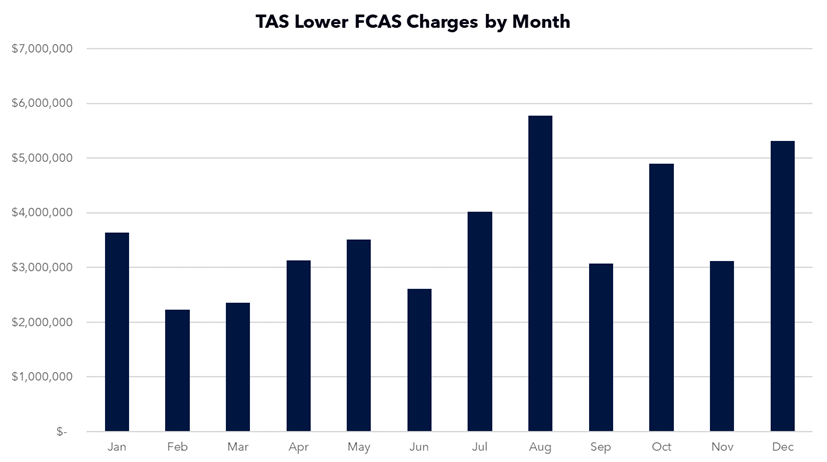
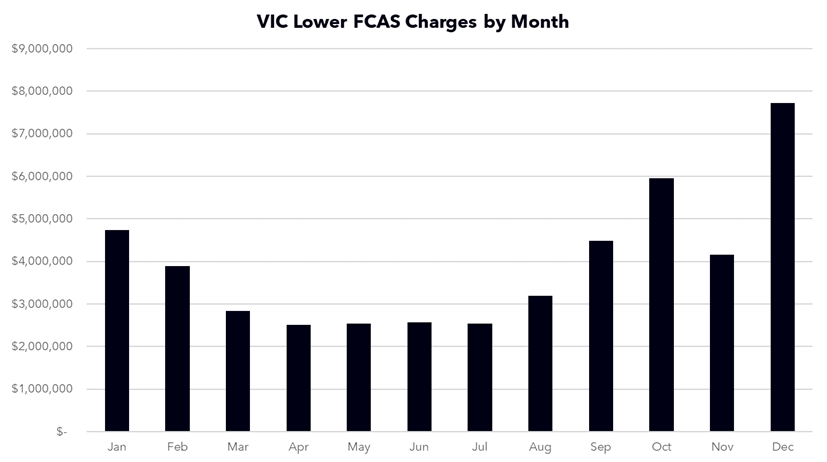
Edge have investigated seasonal trends from FCAS cumulative costs, specifically with regards to lower FCAS. Raise FCAS charges are paid by the causer (generator), and lower FCAS charges are paid for by the consumer.

Firstly, considering the raw data, we can observe that there does appear to have been some increase in total FCAS charges by year, however specifically, we can see that these mostly come in large spikes in one state’s FCAS charges in a specific month, as opposed to all states growing proportionally.

Excluding the monthly breakdown, the data shows FCAS charges growing from 2018 to 2022, with a reduction in 2023. Notably, the summer of 2024 and the December 2023 period were under the RRO in SA, and the summer was notably mild compared to forecasted conditions, which may have impacted FCAS pricing during that period.

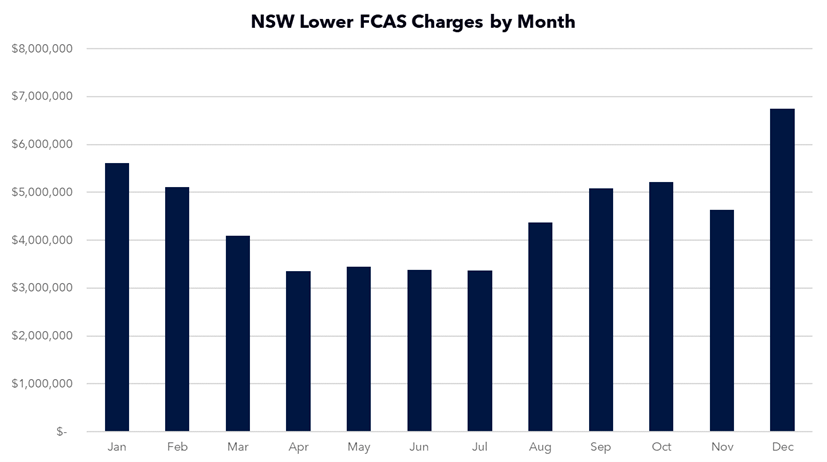
An analysis of the monthly data reveals state-specific seasonal trends, occasionally disrupted by anomalies or significant events. Analysing the monthly patterns for each state reveals the following seasonal effects:

In New South Wales, FCAS charges are typically lower in the winter, increasing from August to January before declining.

In Queensland, FCAS charges primarily occur from August to November, though Queensland remains highly reactive, with spikes in March and May reflecting this behaviour.

South Australia reflects behaviours from both New South Wales and Queensland, where FCAS charges rise post-winter and through spring, with significant spikes in 2020 and 2019 elevating the averages for February and November, respectively.

Tasmania has no obvious seasonal effects observed with prices remaining relatively consistent throughout the year.

Victoria mimics behaviours similar to New South Wales, with low FCAS charges in winter, increasing from August to January before declining.

Depending on the state, strategies could be developed to proactively lower FCAS charges, particularly in response to sudden frequency deviations over short periods. Energy users can deploy onsite batteries or demand side response abilities, that discharge during periods of high FCAS pricing to provide spontaneous services.

The highest payout services are predominantly Lower slow 60sec and Lower fast 6sec, which require batteries capable of responding within the specified 60-second and 6-second windows. While there is a very fast FCAS market (1-second raise / lower), this market is currently used less compared to the standard 6/60-seconds markets.

Queensland Operational Demand Records

In 2024, Queensland has experienced extreme fluctuations of operational demand, reflecting the complexities of the ongoing energy transition. From record high demand peaks in January surpassing 11GW, to unprecedented lows in August below 3GW, the Queensland grid has been stretched in both directions, highlighting the challenges of integrating renewable energy sources into a grid previously dominated by fossil fuel baseload.

On 22 January, Queensland recorded an all-time maximum demand exceeding 11,000MW, smashing the previous record by approximately 800MW. This surge in demand was driven by very hot and humid weather, leading to a substantial increase in cooling loads across the state.

In stark contrast, on 18 August, Queensland registered its lowest operational demand in at least 24 years, dropping to 2,975MW. This significant dip was primarily due to the increased penetration of rooftop solar, which contributed an estimated 3.8 to 3.9GW of electricity during this period. With such a large portion of the state’s power being generated by rooftop solar, electricity prices during daylight hours plummeted.

However, this record low demand driven by solar, resulted in approximately 1.8GW of variable renewable energy (VRE), predominantly from solar, being curtailed during this period. This only left 745MW of utility scale solar feeding into the grid. This level of curtailment underscores the growing challenge of balancing the supply and demand of renewable energy, particularly as rooftop solar continues to expand while storage solutions lag behind.

The previous low demand record was set in October 2023 at just over 3GW. As we approach September and October of this year, there is anticipation that demand could drop even further as traditionally this is the lowest period for demand. However, this will depend on factors such as luminosity, rooftop PV generation, and temperature, potentially leading to reduced electricity prices and increased curtailment.

This situation also raises concerns about the oversupply of solar energy and the urgent need for further investment in grid infrastructure and storage solutions required to manage these fluctuations.

One of the most significant issues facing the broader market is the impact of rooftop solar PV, which operates outside the traditional market, causing electricity prices to crash during sunny hours. This, in turn, pushes out utility scale solar and other sources of generation, presenting a challenging issue going forward of managing different types of renewables and preventing them from significantly cutting into each other resulting in curtailment.

Future Made Australia – economic intervention for good or not?

Last month the Albanese government announced a sharp move from the long adopted, and World Trade Organisation stance, of free markets with little economic intervention, by announcing the Future Made Australia Act. It is going to make the government a “more strategic, more sophisticated and a more constructive contributor” to the economy. It will pull in existing initiatives including the Hydrogen HeadStart, Reconstruction fund and Solar SunShot programs as well as build out more investment within communities.

There is no doubt this is based on the US Inflation Reduction Act which became law in 2022. This left countries like Australia at a significant disadvantage to investment and we have lost out on major investment and economic green growth due to the international pressures, with an anticipated half a trillion dollars of investment flowing into the US following the Act. Noting of course their FED announcement last week showing it may not be working as well as anticipated for the economy as a whole.

However, the concern is twofold. Can our manufacturing gear up quickly enough while being cost effective to support this growth and will such an inward economic policy anger our trade partners. I am specifically thinking of China who relations are already strained and exports from Australia are already banned. With so much of the renewable economy, especially investments as well as solar panels, coming from Eastern Asia, do we risk stealing from Peter to pay Paul in one sector while hurting another?

Yet could it be a forward move from Australia? With the Carbon Boarder Adjustment Mechanism (CBAM) under review as of last September and the European Union implementation in place, could the increase in onshore manufacturing assist with those industries who are undercutting Australian entities, which must operate in a market which is subject to higher standards? With the Safeguard mechanism now in place and the increasing cost this will bring to those sectors affected, specifically mining, steel and cement, could a CBAM coupled with domestic supply help in the short term.

I am sure that this is the aim and ambition if you ask those in Canberra, however significant opposition has been raised across the board regarding the cost of subsidising such a move. Yet if we look to the US and Europe their grids have been underpinned by similar investments and capacity payments, is this more the only way to bring industry along, rather than expect the market to do it for us? With targets far exceeding the likely climate outcomes within Australia and the sheer size of investment required to get anywhere close to targets, is this the last roll of the dice for the Labor government to meet these targets which they have pledged to achieve.

Tightening in the ACCU Market

Person using a laptop with carbon credit and sustainability icons floating above their hands, including CO2, recycling, solar energy, and net zero symbols.

The Department of Climate Change, Energy, the Environment and Water (DCCEEW) intends to stop the development of the Integrated Farm and Land Management (IFLM) method.

The reasoning is due to difficulties demonstrating the environmental benefits of regeneration activities in areas not previously cleared. Instead, the DCCEEW has proposed a new system to be developed, the Landscape Restoration Method (LRM), which considerably tightens grazing activities compared to the previous Human Induced Regeneration (HIR) method.

As a result, the market responded to the news with increased activity for HIR ACCUs and price firming for both generic and HIR ACCUs. The generic ACCU market has firmed since late last year, increasing from the $31-$32 range to $36.

Depending on the scope of allowed grazing activities under the future IFLM or IRM, the market could significantly move. The IFLM method was initially expected to fill the supply gap created after the retirement of two major methods by the end of 2024.

The ACCU market is currently priced to increase into the future, with a cost of carry of ~7%. This is ultimately driven by demand from safeguard participants and some voluntary demand associated with sustainability targets.

The current baselines decrease by 4.9% each financial year out to 2030, with an emission reduction contribution of 65.7% in 2030. The demand for ACCUs to offset organisations’ emissions is anticipated to surpass ACCU issuance for the first time in 2028. The high demand and low issuance are currently forecasted to continue until 2031, where demand for ACCUs is forecasted to peak at 31 million certificates. This is significantly up from 2022, where demand from scheme participants was less than 1 million. However, facilities that are covered by the Safeguard Mechanism are able to generate SMCs, which are a new type of credit issued as a reward for emitting below one’s limits, which could ease overall demand on ACCUs.

The Australian Government has made ACCUs available to liable entities at $75/cert, increasing with CPI plus 2%, ultimately setting a price cap for them. In future years, when supply and demand become tighter, could we witness an ACCU market consistently trading at or near the cap, similar to the current STC market?

The Importance of Eraring and Ongoing Negotiations

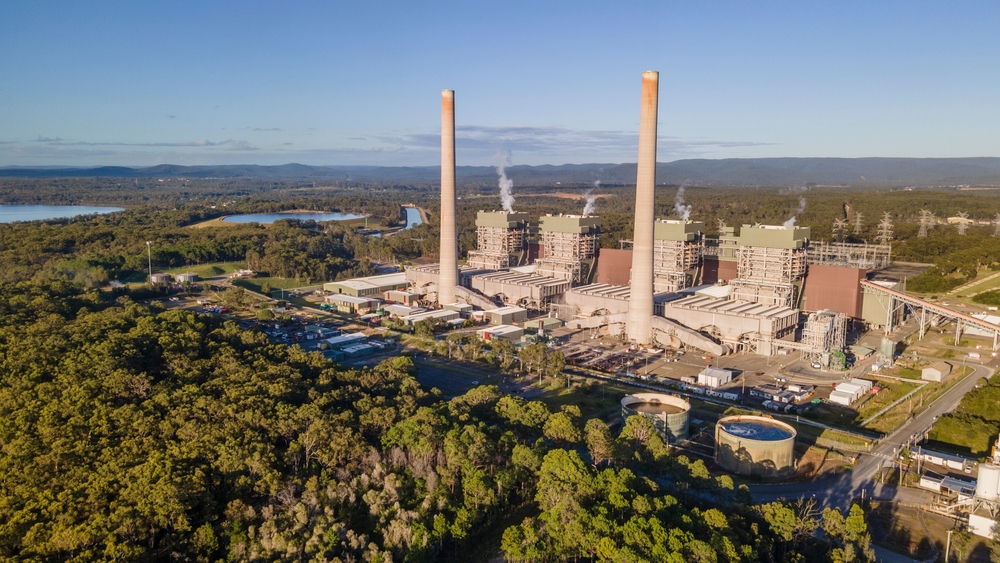
Aerial view of a coal-fired power station with tall chimneys emitting smoke, surrounded by forest and a body of water in the distance.

Eraring, which is forecasted to close in August 2025, has highlighted its necessity to stay online by playing a vital role in the NSW grid. This was demonstrated on February 29 during high temperatures, where demand exceeded 13GW, reaching the highest level since February 2020. During this period of high demand, electricity prices soared towards the market cap of $16,600 and remained volatile for over an hour, adding approximately $13/MWh to the quarterly average to date. Eraring was supplying up to 16.5% (or 2.2GW) of the state’s power during this period.

Without this generation, the state likely would have enacted RERT or possibly load shedding to ensure grid stability, further adding pressure to keep the unit online until there is ample renewable generation and storage to cover the capacity leaving the grid.

Origin stated that Eraring operated as normal on February 29, which “performed well to meet customer needs and support the market”. However, there is a lot of uncertainty and nervousness around the retirement of coal power plants in the NEM, which need to be replaced by clean energy, and the new transmission lines required to connect them to the grid. These are faced challenges such as planned delays, community opposition, and rising costs.

Negotiations between Origin Energy and the state government about keeping it on have been dragging on for about six months now. Origin is seeking a safety net to avoid losses associated with keeping the unit online. However, NSW Treasurer Daniel Mookhey said on Wednesday that the negotiations about keeping Eraring open were “not an opportunity for Origin to make a windfall gain at the public’s expense”.

The two main issues that will affect the cost of Eraring operating post its original closure are onsite ash dam storage issues and no current coal contracts past its closure. Eraring’s ash dam storage is currently at capacity, and as a result, will need to ship ash waste offsite in the future. Additionally, Eraring has no long-term coal contracts post its closure, as a result, Eraring will have to enter into a coal contract at a higher price as coal has significantly increased in recent years. Depending on whether the government subsidizes this cost, Eraring’s running cost could increase significantly, therefore lifting the market significantly due to Eraring’s size and role in the NSW grid.

Progress of Snowy 2.0

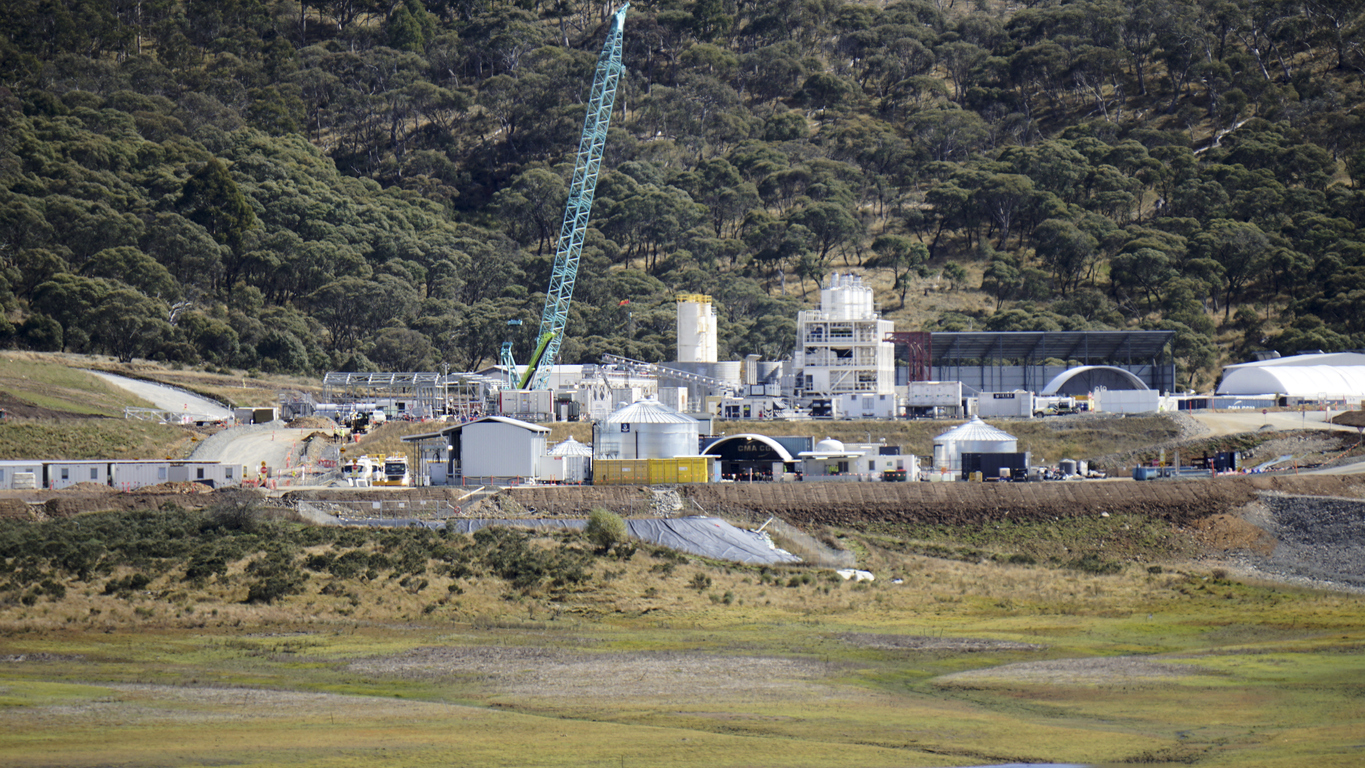
Active construction site of Snowy 2.0 hydroelectric project with cranes and temporary buildings on a rugged landscape.

Since the beginning of construction, Snowy 2.0, a pumped storage power station, has faced a variety of challenges and issues, including the tunnel boring machine getting stuck late 2022 and the project being well over budget, more than double the previous estimate, and six times the ballpark figure given by Malcolm Turnbull.

Despite these setbacks, rock conditions are currently good, and in a year’s time, the project is forecasted to have created an underground cavern that should be big enough to accommodate a 22-story building. This will house the $12b 2.2GW system with a storage capacity of 350,000MWh (159 hours at full power), which is forecasted to reach full commercial operation by December 2028.

Snowy Hydro CEO Dennis Barnes stated they are approximately 51% of the way to completing the project, but there is still a lot to de-risk going forward.

The tunnel boring machine Florence, which got stuck in September 2022 due to unexpected soft ground, was stuck only 140 metres into its 16-kilometre journey. Florence has begun to move again in December 2023, but moving at a rate of 6 metres per day. In order to stay on target, Florence will need to pick up the pace to 12 to 15 metres a day.

According to Barnes, Snowy is considering a fourth boring machine to ensure the project will keep on the revised target, with the decision being made in the following months.

Projects such as Snowy 2.0 providing long-term storage are crucial for the energy transition in the NEM, being able to provide firming capacity during solar and wind droughts, which will inevitably occur. This will allow for the retirement of coal units, as well as allow for a total of 6.6GW of new renewables into the system.

Even with the need for such projects, the project has faced backlash due to the cost blowing out considerably higher than initial estimates, particularly when the additional $8.5 billion of connecting transmission to the north and south is included.

Despite the range of challenges faced by Snowy 2.0, including budget blowouts, difficulties with the tunnel boring machine, and delays, the project is showing progress and plays a key role in achieving Australia’s renewable energy targets.


Callide Legal Action and Regulatory Challenges

Safety worker in hard hat pointing at electrical transmission towers under a colorful sunset sky, highlighting energy infrastructure.

Callide is facing increased scrutiny as the Australian Energy Regulator (AER) is taking legal proceedings against Callide Power Trading due to an explosion at Callide C. In May 2021, an explosion at Callide C4 led to the tripping of multiple generators and high-voltage lines in Queensland, leaving nearly half a million homes to lose power.

The AER alleges that Callide Power Trading broke the National Electricity Rules (NER) by not adhering to its own performance standards for Callide C4. According to the allegations, the C4 unit lacked a protection system in place or having sufficient energy supply to suddenly disconnect the unit when the explosion occurred.

Justin Oliver, an AER board member stated that “Failure to comply with these standards can risk power system security, see consumers disconnected from power supply and cause wholesale energy prices to increase during and beyond these events”.

Callide C3 is expected to fully return on March 31st, with C4 following on July 31st. These are revised dates following various delays affecting both units.

In a separate incident, the Federal Court ordered IG Power, who owns 50% of Callide to appoint special administrators with powers to complete a new investigator into the incidents at the power station.

There is currently no date set for the AER’s matter to be heard at Federal Court.

This highlights the immense pressure on the energy industry and regulation to suppress spot prices in the NEM. This pressure has come in various forms including market directions, price caps on underlying fuel sources such as coal and gas, and retailer reliability obligation (RRO) being enacted in SA this summer.

This pressure has been evident in the spot price, as the spot price over the summer has been very soft, particularly in South Australia and Victoria, with prices being far below forecasted and previously traded levels.

This has caused issues for generators leading Engie to announce the early closure of two units in SA, removing 138MW of capacity from July 1, brought forward from an initial closure scheduled for 2028. This is due to financial reasons as losses have been mounting at the plants, unable to make a profit in the spot market.

There is currently a T-3 forecasted in South Australia from December 2025 to February 2026. Following the recent RRO witnessed over the summer in South Australia where spot prices have been low, volatility has been minimal, and there have been few system security issues in the state. Will we see any revisions or changes to RRO in the future?

Potential for Below Baseline REGOs

Two silhouetted figures stand on a platform at sea, observing a vast offshore wind farm against a dramatic sunset sky.

LGCs are now in an interesting position. With the REGO scheme all but fully legislated to start in 2025, there may be opportunity to meet voluntary requirements from this secondary market before it becomes the likely primary market at the end of 2030 until 2050.

The REGO scheme looks likely to exist in parallel to the LGC scheme until the expiry of the RET, with generators able to decide which products they would like to produce in any given period.

However, the REGO scheme will open previously un-tapped generation, such as below baseline generation, generation from outside of the Australian economic waters area and exported generation i.e. Sun Cable, which the LGC cannot. Further (although unlikely before 2030), STCs can be pooled to create 1 MWh, i.e. 1 REGO certificate at the point the 1MWh limit is reached.

This market is currently untapped, but with a REGO holding the same credentials as an LGC, the voluntary surrender optionality (RET Liability must still be met with LGCs until 2030) can be achieved through the REGO scheme.

With voluntary surrenders increasing, the CER estimated in 2022 a total of 7.4million LGCs were surrendered voluntarily. This increased the demand for LGCs by 1.6million in comparison to 2021 and created a demand 23% above the legislated requirements for LGCs (33m).

Prior to a REGO scheme, the increasing demand for these LGCs has come from growing corporate targets either directly into the LGC market or through its secondary market, such as GreenPower schemes.

Without increasing the availability of alternative generation sources, this growth could lead to a tightening of the supply-demand balance of the LGC and an increase in price. As such the introduction of a REGO from 2025 could be the pressure release valve the industry requires.

The growing non-RET requirements are significant, and therefore, the introduction of secondary sources of power through the REGO scheme is the only way the market will be able to meet the increasing demand.

The ACCC investigation into Momentum in 2016, where Momentum was handed a $54,000 fine for falsely advertising their green credentials, as they are backed by Hydro Tas whose generation was below baseline, has brought to the fore the requirement for accreditation of these below baseline assets (outside of the i-REC scheme).

Below baseline is renewable generation assets created before 1997 – mainly hydro assets. The baseline is set on production between 1994 – 1996, and therefore, generators coming on from 1997 have a baseline of zero and can produce LGCs, unlike those online prior to 1997. Indications are these facilities generate 12-13TWh of electricity each, that is, 12-13 million REGOs, which could come into the Australian voluntary market (pre-2030 RET end). However, the below baseline generation is eligible for an i-REC certification and many assets pursued this option prior to the REGO /GO scheme announcements. As such, this 12-13 million may be as low as 2 million in the initial years, given existing PPAs and voluntary i-REC surrender deals in place.

It is worth noting, if Hydro Tas had created the REGO and these were surrendered against the Momentum portfolio, the renewable claim would have been upheld, and the REGO would have never hit the market. This example shows that even if produced, companies may utilise the additional certification without giving others the opportunity to trade them in the open market.

A concern does sit around the inclusion of small-scale renewable REGOs, although unlikely to be in large quantities prior to 2030, the concern holds that the measurement of the “hour” the REGO is produced, when the cumulative units have reached 1MWh of generation, is currently untested and there are a significantly larger number of these units than there are utility scale solar. The cost and oversight required could add cost to the certificate, which we currently have no view of as to the uptake or requirements.