Dramatic decline in electricity prices predicted as a result of the NEG

The AFR published an article last night which refers to the final design of the National Energy Guarantee (NEG) which was provided to the state and territory leaders on Monday. Within the article is a graph containing forecast NEM wholesale prices (real 2018 $/MWh) from FY18 to FY30, as seen below. The forecast comes from Acil Allen Consulting. Unfortunately, the graph is all that is provided and is therefore impossible for the market to understand what the assumptions are behind the modelling. When releasing forecasts that show dramatic changes in energy prices it should be explained in detail so that stakeholders can understand the key drivers behind the decline. By making the assumptions available, stakeholders are then empowered to make their own assessment on the accuracy of the forecast.

Source: Australian Financial Review.

The Federal Government is claiming that under the NEG households can expect to save an additional $150/year.

The NEG has gained support across the energy market and looks like it will be agreed on by the states and territories. Federal Energy Minister Josh Freydenberg is scheduled to meet with state and territory leaders on 10 August to gain approval of the policy. If successful the NEG will begin in 2020.

If you would like to understand more about the NEG and the potential impact it may have on your energy portfolio moving forward, please visit edge2020.com.au or alternatively you can call one of our team directly on 07 3905 9220 or on 1800 EDGE ENERGY.

Electricity cost forecasting – is it really that simple?

As the Australian generation fleet transition to lower carbon emissions we are seeing the regulatory framework catching up. The regulatory framework is not the only aspect which is changing. We are experiencing an increasing amount of direct power purchase agreements being written between large users and renewable developers.

Economic models are also struggling to catch up. Almost every month a new forecast is published showing that if we just implement the latest proposed change to the market, we will see a return to the good old days of lower electricity prices. Part of this fallacy comes from outdated forecasting models which still look at cost of production as the main input to power prices. Short term price spikes and managing the grid in a sub-five minute period is increasingly important. Most current forecasting techniques fail to capture these factors as well as transient market power where a generator is able to set prices for a period by changing the volume offered in bid bands.

Behaviour is difficult to predict over the long term so most models assume rational behaviour in the long run. This is essentially sensible (it is very difficult to measure irrational behaviour) however begs the question how to model rational behaviour. In the electricity market, we will generally see future costs (over a very long term) trend towards the cost of bringing new plant online. If the long term prices are higher than the cost of new generation, someone should fund additional generation providing a natural cap.

The issue in current forecasting is determining the cost of bringing a new plant online. Traditionally, this has been the total cost of the plant divided by the number of MWh it produced. This provided a neat number expressed in $/MWh and is the basis for levelised cost of electricity (LCOE). The issue with using this number is that price profiles are changing and could be negatively impacted by the type of generation being evaluated. If we look at a solar farm in Queensland, we can estimate the production and the cost of the solar farm. This is the LCOE however it may not be the value of the solar farm, or produce the best estimate of the cap on long term electricity prices. In the event a large number of solar farms are built in the same location, there will be a large production at that time of day and not at others (evenings, mornings and overnight). Other generation sources will be required to fill the gaps. These other sources could have a higher cost and will only be built once there is a price signal to do so. The cost of electricity will be low during daylight hours when all the solar farms should be in full operation. This means that the value of the generation from solar reduces as more is built. This is not captured in the LCOE of generators. A new methodology which looks at the dispatch weighted (when generation occurs) achieved price will have to be considered when evaluating future electricity prices.

The impact of changing long term electricity forecasts are important. Many new plant rely on a component of their generation to be funded from the electricity spot market. With large changes in the assumed cost of electricity as models react to short term announcements it is very difficult to bank a project. On the other side, where consumers are being provided with different assumptions on future prices, it is difficult for them to commit to a purchasing strategy leading to more short term optimisation.

If you are considering a large investment in the electricity market, please call us on 1800 334 336 to learn more about the determination of electricity costs and gain a deeper understanding of the traded market.

Have you exceeded your baseline under the Safeguard Mechanism?

Following the close of the financial year 2018 NGER reporting period, responsible entities will need to determine if they have exceeded their baseline under the Safeguard Mechanism.

The safeguard applies to around 140 large businesses that have facilities with direct emissions of more than 100,000 tonnes of carbon dioxide equivalence (t CO2-e) per year. This covers around half of Australia’s emissions. The entity with operational control of a facility will be responsible for meeting safeguard requirements, including that the facility must keep net emissions at or below baseline emissions levels.

There are various methods for a facility to meet its safeguard requirement depending on its emissions, how it operated during the financial year and its expected operation in the future. Understanding the best way of meeting the baseline is critical to avoid having to overpay under the mechanism. Responsible entities have until 31 October 2018 to submit their financial year 2018 report and apply for any change to benchmark calculations. If a responsible entity still exceeds their baseline, they have until 28 February 2019 to secure Australian Carbon Credit Units (ACCUs) to offset their excess emissions.

Edge is able to provide entities with data that supports your NGER reporting requirements. Edge also works with various buyers and sellers of ACCUs and can assist with the sale or purchase of certificates if required.  Finally, if your business has been caught with excess emissions, Edge can proactively design strategies to help mitigate costs under the mechanism.

If you would like to explore services relating to NGER reporting requirements and have any questions regarding the Safeguard Mechanism,  call Edge on 07 3905 9220 or 1800 334 336 or speak with your Edge Portfolio Manager.

AEMO Release Inaugural System Plan

This morning AEMO released their inaugural Integrated System Plan (ISP). The plan is an evaluation of the likely changes that will be occurring over the next 20 years across the NEM. The ISP builds on the work of AEMO’s annual National Transmission Network Development Plan, and has been developed in response to the COAG Energy Council’s decision in 2017 to adopt the recommendations made in the Independent Review into the Future Security of the National Electricity Market, specifically pertaining to the need for a strategic national plan. AEMO have used probabilistic scenario based analysis and system optimisation to project the reliability and security needs of the power system while simultaneously identifying the lowest cost combination of resources to meet system and consumer needs. The ISP also incorporates projected Federal emissions policy and State renewable policies.

AEMO’s analysis has identified the following fundamental changes occurring in the energy sector:

  • Grid demand is flattening due to the growth of rooftop photovoltaic (PV) and increasing use of local storage, as well as overall increases in energy efficiency. This is true even with the anticipated electrification of the transport sector over the period.
  • Over the next 20 years, approximately thirty percent of the NEM’s existing coal power stations will be approaching the end of their technical lives, and will likely be retired, which highlights the importance of mitigating premature retirements as these resources currently provide essential low-cost energy and system support services required for the safe and secure operation of the power system.
  • The investment profile and capabilities of various supply resources have changed and are projected to continue to change radically.
  • In particular, costs of new renewable plant continue to fall, and advances and availability of storage technologies, particularly pumped hydro, flexible gas-powered generation and distributed energy resources (DER) are emerging as core components to a low cost and reliable energy future.

The ISP finds that a portfolio approach of supply resources includes both retention of existing resources and continued growth of utility-scale renewable generation, energy storage, DER, flexible thermal capacity, including gas-powered generation, and transmission development to be the most efficient approach.

AEMO has identified three “Groups” which distinguish actions that a recommended to be taken in the near, medium and longer term.

 Group 1: Near-term construction to maximise economic use of existing resources

Immediate action is required to maximise the economic use of existing low-cost generation. Investment is also required to facilitate the development of projected new renewable resources to replace retired and retiring resources, and to provide essential system security.

  • Immediate investment in transmission should be undertaken, with completion as soon as practicable, to:
    • Increase transfer capacity between New South Wales, Queensland, and Victoria by 170-460 MW.
    • Reduce congestion for existing and committed renewable energy developments in western and north-western Victoria.
    • Remedy system strength in South Australia.


Group 2: Developments in the medium term to enhance trade between regions, provide access to storage, and support extensive development of Renewable Energy Zones (REZs)

The ISP shows that an interconnected energy highway would provide better use of resources across the NEM, through both access to lower-cost resources and realising the benefits of diversity from different resources in different locations with different generation profiles.

  • Action should be taken now, to initiate work on projects for implementation by the mid-2020s which would:
    • Establish new transfer capacity between New South Wales and South Australia of 750 MW.
    • Increase transfer capacity between Victoria and South Australia by 100 MW.
    • Increase transfer capacity between Queensland and New South Wales by a further 378 MW.
    • Efficiently connect renewable energy sources through maximising the use of the existing network and route selection of the above developments.
    • Coordinate DER in South Australia.
  • AEMO will coordinate work with project proponents on a design for transmission networks to support strategic storage initiatives (Snowy 2.0 and Battery of the Nation).


Group 3: Longer-term developments to support REZs and system reliability and security

In the period from 2030 to 2040, a significant amount of the NEM’s coal-fired generation is expected to reach end of technical life and retire. As noted, given the scale of the investment and building time required, it will be important to retain existing coal-fired generators until the end of their technical life to maintain reliability.

  • In the longer term, to the mid-2030s and beyond, the capability of the grid should be enhanced to:
    • Increase transfer capacity further between New South Wales and Victoria by approximately 1,800 MW.
    • Efficiently connect renewable energy sources through additional intra-regional network development.


If you have any questions regarding AEMO’s ISP or how you can best position your company in response to the changing energy market please get in contact with Edge on 07 3905 9220 or 1800 334 336.

ACCC’s recommendations aim to restore electricity affordability

Malcolm Turnbull was in Brisbane today promoting “lower energy prices” on the back of the public release of the ACCC’s “Restoring electricity affordability and Australia’s competitive advantage”. The 398 page report is extensive and contains 56 recommendations across the spectrum of the energy market. Edge highlights a couple of key recommendations below.

Recommendation 1

The NEL should be amended to prevent any acquisition or other arrangement (other than investment in new capacity) that would result in a market participant owning, or controlling dispatch of, more than 20 per cent of generation capacity in any NEM region or across the NEM as a whole.

The provision should be designed to prevent market participants circumventing the 20 per cent cap, including by way of ownership structure or contractual arrangements.


Recommendation 2

The Queensland Government should divide its generation assets into three generation portfolios to reduce market concentration in Queensland. The three portfolios should be of a similar size with a mix of generation assets to maximise competition in the wholesale market.

Once created, the Queensland Government should ensure that the three portfolios are separately owned and operated to maximise competition in the wholesale electricity market. The sale of any portfolios should be in line with recommendation 1.


Recommendation 4

The Australian Government should operate a program under which it will enter into low fixed-price (for example, $45–50/MWh) energy offtake agreements for the later years (say 6–15) of appropriate new generation projects which meet certain criteria. In doing so, project developers will be able to secure debt finance for projects where they do not have sufficient offtake commitments from C&I customers for later years of projects. This will encourage new entry, promote competition and enable C&I customers to access low-cost new generation.

The program should operate for at least a four-year period, with support provided for qualifying projects. To qualify, a project proposal must:

  • have at least three customers who have committed to acquire energy from the project for at least the first five years of operation
  • not involve any existing retail or wholesale market participant with a significant market share (say a share of 10 per cent or more in any NEM region)
  • be of sufficient capacity to serve the needs of a number of large customers
  • be capable of providing a firm product so that it can meet the needs of C&I customers.


Recommendation 5

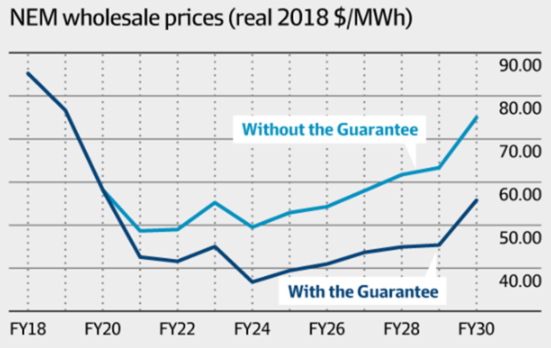
The National Energy Guarantee seeks to provide a settled policy framework under which new investment is encouraged in a way that enables achievement of the objective of reducing carbon emissions at low-cost while promoting investment in a manner that ensures demand for energy is met.

The ACCC agrees that this is an important policy objective and, with the policy incorporating appropriate safeguards for competition in the contract market, recommends that governments commit to develop and implement the National Energy Guarantee.


Recommendation 6

The NEL should be amended so as to require the reporting of all OTC trades to a repository administered by the AER. Reported OTC trades should then be disclosed publicly in a de-identified format that facilitates the dissemination of important market information without unintentionally revealing the parties involved.

The requirement should be implemented to align with (or be eligible for) any OTC reporting requirements under the NEG.

The AER, AEMC and AEMO should have access to the underlying contract information, including the identity of trading partners.


Recommendation 7

The AEMC should introduce market making obligations in South Australia, which require large, vertically integrated retailers to make offers to buy and sell specified hedge contracts each day, in order to boost hedge market activity. The parameters of a market making obligation should have regard to:

  • the size of the South Australian market
  • the distribution of generation ownership in the region
  • the benefits to market liquidity and efficiency of regular trading activity
  • the burden of the requirements on obligated entities
  • any impact on the incentives of intermittent generators to invest in firming technology.


After an appropriate period of time (for example, after two years) the mechanism should be assessed for its effect on market activity, liquidity and risk to determine if it should be continued, amended or removed in South Australia and, potentially, extended to other NEM regions.


Recommendation 11

The governments of Queensland, NSW and Tasmania should take immediate steps to remedy the past over-investment of their network businesses in order to improve affordability of the network. With appropriate assistance from the Australian Government, this can be done:

  • in Queensland, Tasmania and for Essential Energy in NSW, through a voluntary government write-down of the regulatory asset base
  • in NSW, where the assets have since been fully or partially privatised, through the use of rebates on network charges (paid to the distribution company to be passed on to consumers) that offset the impact of over-investment in those states.


Such write-downs would enhance economic efficiency by reducing current distorting price signals. The amount of the write-downs and rebates should be made by reference to the estimates of over‑investment by the Grattan Institute, and should result in at least $100 a year in savings for average residential customers in those states.


Recommendation 21

In relation to wholesale demand response, a mechanism should be developed for third parties to offer demand response directly into the wholesale market. Design of the mechanism should commence immediately, building on work undertaken in the AEMC’s Reliability Frameworks Review. The mechanism should:

  • promote competition through allowing the widest range of businesses to directly offer demand response services
  • not allow retailers to limit the ability of their customers to engage a third party demand response provider (to the extent it is not inconsistent with the retail contract)
  • ensure load and generation response are valued appropriately based on the benefit they provide to the wholesale market
  • limit technical requirements placed on the customer that may inhibit take up or scope of these services (for example, requirements for multiple meters at the customer site).


Recommendation 24

The SRES should be wound down and abolished by 2021.


By in large the recommendations made in the report should help to put downward pressure on electricity prices. Mr Turnbull said today that if prices do not come down after implementation of selected recommendations that alternative actions will be taken.

The full report can be found on the ACCC website here.

If you have any questions on how you can achieve better pricing outcomes on your energy please get in contact with Edge on 07 3905 9220 or 1800 334 336.

STAFF PROFILE – Justin King

With a career spanning 20 years and experience across many different technologies, Justin brings an incredible depth of knowledge to our development team. He is passionate about accurate reporting and scalable solutions which are the cornerstones of our business. Justin’s experience in the energy industry means he knows what our clients need. By building systems and developing specialised reporting, he gives them time and space to focus on business growth.

What is the best piece of advice you have ever received?

A boss once told me “Assumptions are the mother of all stuff ups.”

Name a place you have never been to and would like to visit. Why?

One of my future goals is to ride a motorcycle from Anchorage Alaska across to Canada and down the entire West Coast of America to San Diego, hopefully with one of my close friends to enjoy the experience.

Who or What inspires you?

One person who comes to mind is Roger Federer. He has been at the top of his game, passionate and above all you never see him disrespect others or complain when he has been beaten when he gave his best.

What is one of the biggest challenges facing energy customers today?

New and exciting technologies can be both a blessing and a curse. Batteries, Solar and Wind are growing in generation every year, however this requires upfront investment in time and money and ensuring the return is worthwhile.

What does a typical day look like for you at Edge?

As an early starter, I get in around 7 am and the first thing I will do is check all our systems for any outages or data files that have not arrived for the day. Then we plan our day and what features we are going to work on that adds value to our customers as well as enhancing any existing systems to make them more robust. Each day throws different challenges and new opportunities which makes my role exciting, which is what I love about working at Edge.

Gas Market Update

By Nick Clark, Energy Analyst

Domestic gas prices on the east coast of Australia have been through a huge transitional period as a result of the introduction of the LNG export market from Curtis Island. Whilst there have been a broad range of changes, one of the key factors increasingly influencing price that domestic consumers pay is the price of oil. Domestic contracts are now being offered at oil linked pricing which effectively means that if the price of oil increases so will the price of your gas (and vice versa). For large gas producers this is nothing new as hedging commodity prices is part of their core business. For consumers however this may be more challenging depending on the products they produce.

Other factors that are now impacting Australian gas prices are:

  • Climate change policies in Asia as gas is a widely used fuel for clean electricity generation. This is particularly important when considering China due the huge demand and current reliance on coal generation.
  • Manufacturing levels in Japan
  • US production levels and construction of pipelines
  • Renewable energy technology developments


Turning our attention to domestic gas influences the Northern Territory Chief Minister Michael Gunner has recently announced that the 135 recommendations made in the recent inquiry into fracking in the NT would be implemented, allowing on-shore fracking to take place in the territory. The 135 recommendations made in the inquiry mitigate the risks associated with onshore gas development to acceptable levels, and in some cases claim to eliminate the risks completely. New gas developments will require environmental management plans which will be assessed by the NT Environment Protection Authority and signed off by the environment minister. There will also be area’s where fracking will not be allowed. These include indigenous protected areas, special environmental areas, cultural and agricultural areas of significance to the Northern Territory. There is a number of studies to be completed before fracking production can begin including strategic environmental and baseline assessments. At this stage it is estimated that exploration will begin in 2019 and production in 2021.

On 21 May Santos Rejected Harbour Energy’s (Harbour) offer to purchase 100% of shares at US$5.21 per share. In an effort to get the deal over the line Harbour offered $5.25 per share if Santos was willing to extend certain oil price hedging arrangements. The final offer from Harbour had a number of conditions which included Santos assisting with debt raising and hedging a significant portion of Santos oil-linked products as well as FIRB approval. Once the offer was rejected Santos shared its view on how superior shareholder value could be realised through executing the current strategy.

Australian Industrial Energy will see Port Kembla in NSW developed into an LNG import terminal.  The Andrew Forest venture recently reached significant milestones. These include receiving backing from Japanese energy giant JERA and signing a memorandum of understanding with 12 potential customers (according the AFR). Project development is still subject to approvals.

AEMO recently released its Victoria Gas planning report update that painted a concerning outlook in respect of depletion of offshore gas fields reserves. The data provided to AEMO from producers in the Gippsland basin forecast production to reduce to 38% below the 2018 production forecast and 68% for Port Campbell. In response to this outlook gas producers and other market participants are investigating additional supply and capacity.

Regional analysis


Narrowing our focus, Edge take a closer look at gas generation in each region and the local gas trading hub. As we know the Federal Government threatened LNG producers with the Australian Domestic Gas Mechanism late last year if they didn’t allocate more gas to domestic consumers. The threat appeared to have worked with each of the LNG producers advocating that they had made gas available.

When we take a closer look at whether a relationship exists between gas generation and gas hub prices we realise that it is difficult to discern. Limitations in access to pipeline capacity, contractual arrangements and sophistication of users are potentially key drivers behind this.

The following graphs display average gas generation from 1 January 2017 to the end of May 2018 on a regional basis as well as the average gas price for the same period.

Queensland


From the graph we can observe that gas generation in 2018 (to date) is largely in-line with 2017. The consistent level of generation is interesting given the significant decline in spot electricity prices in Q118 relative to that of Q117. On face value the lower spot prices in 2018 would result in less generation from gas power stations. What changed however between Q117 and Q118 was SwanBank E power station returned. The gas combined cycle power station ran consistently throughout Q118 averaging 237 MW of generation. Lower spot prices in the Brisbane STTM are a driven by lower demand and potentially increased supply as a result of the LNG producing increasing availability of gas to domestic consumers.


New South Wales

NSW gas generation was significantly down for the first 5 months of 2018 relative to the same period in 2017. Lower gas generation in NSW was largely the result of less volatility in the electricity spot market. If we look at the bid stacks of the large gas power stations in NSW, Tallawarra was the most motivated to produce energy offering up to 210 MW at below zero dollars. This strategy could not be observed at Uranquinty or Colongra.


Victoria


Unlike NSW and QLD generation from gas powered power stations increased in January and February 2018 relative to the same months in 2017. The closure of Hazelwood power station in late March 2017 meant that the 1,225 MW (average generation of Hazelwood in Q117) was no longer available. Less baseload generation in the region resulted in higher electricity prices which meant that gas power stations were dispatched more regularly. Despite the increases in generation there was a decline in VIC gas market prices.


South Australia

Gas generation in SA has been heavily impacted by the increased level of intervention in the SA market by the market operator. The market operator has been constraining off wind generation and calling on gas generation which has increased overall generation from gas plant. This increased generation however has not translated into higher gas prices as we can see from the graph these 2018 prices are trending below 2017 prices.

When observing each of the regions and the time periods selected it is fair to say that generation from gas fired power stations and spot prices in the gas hubs do not drive average price outcomes.

If you would like to know more about what is happening in the gas market and how your business may be affected, please call Edge on 07 3905 9220 or contact your Edge Portfolio Manager.

STATE OF THE ELECTRICITY MARKET – AUTUMN MARKET OVERVIEW

By Thomas Dargue, Edge Manager of Markets & Advisory

The electricity market was active throughout autumn and the transition into winter. Spot prices were largely stable as has been the case ever since the Queensland Government directed Stanwell Corporation to adopt strategies to lower wholesale prices and Snowy Hydro Corporation seem to be willing to draw down their dam levels to keep prices in New South Wales below $300.00/MWh for each trading period.

Stable spot prices doesn’t mean that the market has been uneventful. In Queensland utility scale solar is expected to grow from only having Barcaldine Solar Farm (25 MW capacity) to more than 2,000 MW installed by the end of 2019. In November 2017 Kidston Solar Farm (50 MW capacity) started generating and since April 2018 we have seen the addition of Sun Metals, Clare, and Longreach solar farms with a combined capacity of 248 MW. Other solar farms are being commissioned at the moment including Hamilton, Whitsunday and Hughenden which means that Queensland will soon have 453 MW of utility scale solar. This is in addition to the small scale solar installed already in Queensland which is more than 2,000 MW and continuing to grow.

New South Wales continue to struggle with sufficient capacity.

To date Snowy Hydro has increased its output when prices looked like it was going to go above $300.00/MWh. This strategy has appeared to be successful with only two prices above this level ($300.80/MWh and $301.06/MWh on 25 July 2017 at 18:00 and 18:30 respectively) since the start of 2017. This defence of prices has come at a large cost to the dam levels with the main dam, Lake Eucumbene, dropping below 30% full which is the lowest level since 2011. In early June 2018, constraints prevented much of Snowy Hydro’s portfolio from being dispatched and the New South Wales prices spiked to $2,428.77/MWh and $2,447.89/MWh on 5 June at 17:30 and 18:30 respectively. The high prices followed large cloud cover reducing generation from solar farms and the removal of several large coal plant due to planned or unplanned outages. These outages persisted and there was another price spike on 7 June 2018 at 19:00 where prices in New South Wales reached $2,464.52/MWh. On both days where the prices were high, AEMO had warned that there were insufficient reserve of generation and Tomago Smelter had demand curtailed under their agreement with AGL.

Victoria was comparatively quiet during autumn. Spot prices remain high in a historical context with the period from 1 April to 30 June averaging $94.92/MWh – more than $10.00/MWh higher than New South Wales over the same period.

Victoria use to enjoy an abundance of cheap generation from their brown coal generators however have seen more imports from South Australia and New South Wales since the closure of Hazelwood Power Station. Victoria has an old fleet of highly polluting power stations and need an orderly transition to avoid suffering intermittent issues seen in South Australia.

Tasmania continues to manage their dam levels to avoid the constraints on local manufacturing plant which was experienced during the last extended outage on Basslink. There was trouble on the interconnector again with no flow between 24 March 2018 and 5 June 2018 following an accident during maintenance. The highly specialised nature of the underseas cable means that parts take a long time to procure and then be installed. Overall the state managed to supply electricity throughout the period. The reliability of Basslink is a further cause for concern as Tasmania is trying to become the “battery of the nation” by using its abundant pumped storage hydro sites to effectively store energy while there is excess renewable generation and produce electricity when there is less renewable generation being produced. If the electricity cannot be reliably transferred in and out of Tasmania, the investment decision is less attractive.

South Australia had more price periods affected by market intervention during May 2018 than any other time in the past.
More than half (61%) of the time, the prices were affected by directions from AEMO.

Some of this is due to Pelican Point coming off 23 April 2018 and not returning until 23 May 2018. An intervention price occurs when AEMO has directed a participant (typically a generator) to dispatch in a different way to its bidding. This was typically used to direct a gas or diesel power station to operate through periods where the owner expected it to not be commercially viable to operate. This was done to strengthen the grid by securing sufficient synchronous generation remains online at all times. AEMO then calculates how the market would have settled if they hadn’t issued the direction. This calculation doesn’t take into account the fact that bidding may have been different if the direction hadn’t been issued. Participants could have chosen to turn on voluntarily or wait for higher prices. As such, this will distort the pricing signal provided in the market. Even though spot prices tend to be lower during these directions, participants that are directed are entitled to compensation which is ultimately paid for by the consumers. When the price signal is taken out of the spot market and put directly onto retailers (who pass the costs on), there is little incentive to solve the issue. The total amount of interventions have increased dramatically as the system is getting weaker however it also seems to be part of a new direction from AEMO. To put the number of interventions into context, there were roughly 20 times more intervention periods in May 2018 (5,451) than the 10 years prior (228) to the appointment of the CEO Audrey Zibelman.

Figure 1: Number of prices affected by intervention from AEMO

If the intervention continues, the spot prices will remain lower however the cost to the consumers could increase.

Overall spot prices were lower than the summer period with the cheapest spot prices being in the North and the East. Queensland had the cheapest prices followed by New South Wales and Victoria. Tasmania managed to end the period with lower prices than South Australia despite Basslink being cut off for part of the period.

Figure 2: Average monthly spot prices in the NEM


The more stable spot conditions saw the forward prices decrease across all the traded regions. The largest fall was in Victoria where prices reduced $8.97/MWh for calendar year 2019 contracts. New South Wales also reduced $8.43/MWh as spot prices remained stable. The forward prices are now similar across Victoria, New South Wales and Queensland however South Australia continues to trade higher than the other regions. This is in part due to expectations that the spot prices are likely to stay higher than elsewhere and partly as firm contracts are more difficult to get as many renewable generators are unable to offer firm prices. Recently Snowy Hydro has been acquiring power purchase agreements with renewable generators and released a tender for up to 800 MW of additional renewable generation. It is likely that Snowy Hydro will use its pump storage hydro plant to firm up the renewable generation offering more firm contracts.

Table 1: Calendar year 2019 forward contracts

NSW QLD SA VIC
1 March 2018 76.58 64.05 94.36 82.9
31 May 2018 68.15 62.64 87.00 73.93


If you would like to discuss the electricity market outlook and potential impact to your electricity portfolio, please contact our Manager of Markets & Advisory, Thomas Dargue on 07 3905 9226 or on 1800 EDGE ENERGY.


Autism Queensland – providing specialist education for children with autism for over 50 years

Meet Oliver King!

Oliver is one of our staff members Justin’s’ eldest 10-year-old son. A couple of years ago he was diagnosed with Autism Spectrum Disorder (ASD). He is a very smart, intelligent and loving boy and is known as a High Functioning Autistic, which you may have heard of in the past called Asperger’s syndrome.

Autism affects roughly 1 in 59 children and 1 in 37 boys.  Children like Oliver find it hard to fit into the standard schooling system often requiring extra resources that are not always available.  Luckily for Oliver, he has recently been accepted to attend the Autism Queensland School on a part time basis. Oliver will split half his time between his regular school and Autism Queensland School to give him all the tools in life outside of pure academics. Each class only has 6 children in it of a similar age and skill set to allow for a more tailored and effective educational experience.  Edge would like to wish Oliver and his family all the best for his first day at Autism Queensland School.

Children like Oliver benefit from these services due to generous donations by the public.  You too can assist in making a difference in these children’s lives by donating here https://autismqld.com.au/page/make-a-donation.

Edge Live Supports Greater Flexibility Whilst Maintaining Security

James Webster, Edge Software Development Manager

Edge focuses on ensuring the information we hold about your business’s energy costs and consumption is safe and secure. We also like to ensure that information is only provided to parties within your business, that are authorised to have access to that information.  A challenge for Edge has been to maintain this security requirement through the use of Edge Live, whilst also ensuring it widely accessible by staff within your organisation as possible.

We have recently added some features to Edge Live that can provide you comfort when it comes to providing the right people with access to the right information within your organisation.


  • As an Edge Customer, you are provided your own unique ‘tenant’ within the Edge Live system. Some of our larger customers have multiple tenants, reflecting the organisation of their various business units. Each user is assigned access to one or more tenants. Data is held securely within the scope of a tenant and cannot be viewed unless a user has access to that tenant.
  • We have recently extended Edge Live to support a hierarchy of tenants. A particular tenant may have a parent tenant, or multiple child tenants. This hierarchy can be set up in Edge Live to reflect the organisation of your business. This means that a user can easily view data across multiple areas of your business, without having to switch between tenants.
  • Edge Live data (e.g. sites, invoices, reports, and contracts) is associated to particular groups. A tenant can have multiple groups. While users generally have access to all groups within a tenant, they can be restricted to only view the data belonging to one or more groups.


Not only do these features ensure the security of your information, it also helps us to effectively communicate only relevant data and information with members within your organisation.  For example, on-site personnel may be restricted to reports, meter data, or dashboards associated with the particular site at which they work. Finance personnel may only have access to accrual and invoice reconciliation dashboards and your invoices.

By defining the type of information your staff can access via Edge Live, we can be confident that the information that we provide is relevant to the role they perform, thus giving them the information they need to make informed decisions.

Speak to your Portfolio Manager today about how we can configure your Edge Live tenant and its groups to maximise Edge Live’s userability within your organisation.