Renewables – cheapest generation in Australia

On Friday, CSIRO released a draft of its latest annual GenCost report. The report is used by AEMO for some of its inputs and assumptions in their publications such as the ISP and the ESOO. The report calculates the expected levelised cost of electricity (LCOE) from a range of generation technologies.

In this year’s report, wind and solar continue to be Australia’s cheapest generation technologies. The report also explores the impact of storage on wind and solar, with the addition of batteries, wind and solar still outperform coal and gas.

The 2021-22 GenCost report estimates solar has a levelled cost of between $44 to $65/MWh and wind costs range between $45 to $57/MWh. The large range in costs is a direct relationship between the scale of the projects.

The CSIRO estimate to build a new baseload coal-fired power station would result in a LCOE of up to $118/MWh and gas is not far behind at $111/MWh. For units with a lower utilisation rate compared to a baseload unit, the LCOE would be significantly higher.

The report also looked into the future and predicts how the cost of generation technologies will change. It is likely the cost of coal and gas technologies will remain constants, in my view they will increase as equipment costs increase, access to specialist skilled labour decreases and capacity factors drop. On the other hand, the CSIRO predicts solar, wind, batteries etc will continue to drop in price resulting in lower LCOE into the future.

With a rapidly changing energy landscape, the CSIRO have also looked at the cost of integrating intermittent generation with storage and grid support services. The CSIRO predicts the integration of technologies and services will add as little as $10/MWh to the LCOE of the generation asset alone. Even with this integration, renewable as considerably cheaper than coal or gas-fired generation.

The study also found if Australia goes down the “gas led” recovery it is highly dependent on the cost of gas. There is a slim chance that gas can compete with renewables but only if gas prices are below $6/GJ and the gas-fired generator has a capacity factor of 80% or above.

If any of the existing coal-fired generators go down the track of installing Carbon Capture and Storage (CCS) it will make them less competitive leading to lower capacity factors. CCS is predicted to increase the LCOE of between $162 and $216/MWh. If the technology is used on Gas fired assets it is likely to increase the LCOE to between $107 and $170MWh.

Stepping outside conventional technologies, the CSIRO would envisage if Australia went down the nuclear path it would result in the highest LCOE of any generation technology.

With the move to a hydrogen economy, the CSIRO have also included the cost of electrolysers, while expensive now the expectation is that they will drop in price by 75% over the next 10 years and by up to 90% by 2050.

Although the GenCost report is currently out for stakeholder consultation it is an interesting view into the future of the Australian energy market.

Future of Contract Markets and the Baseload Swap

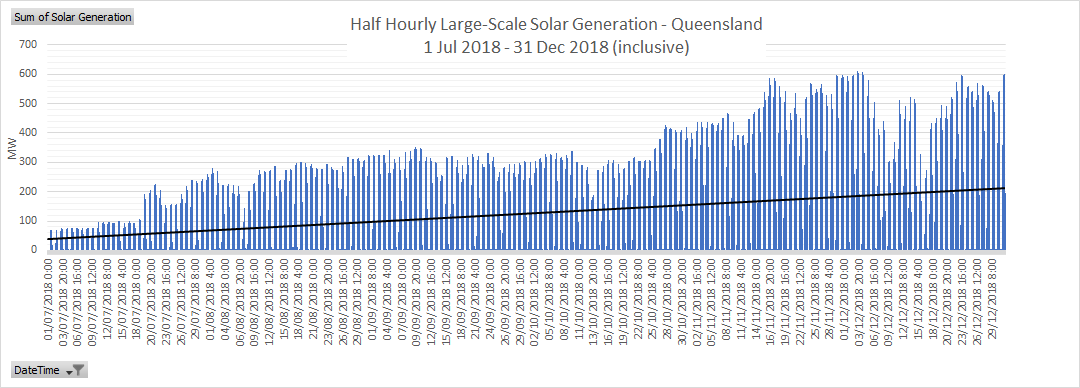
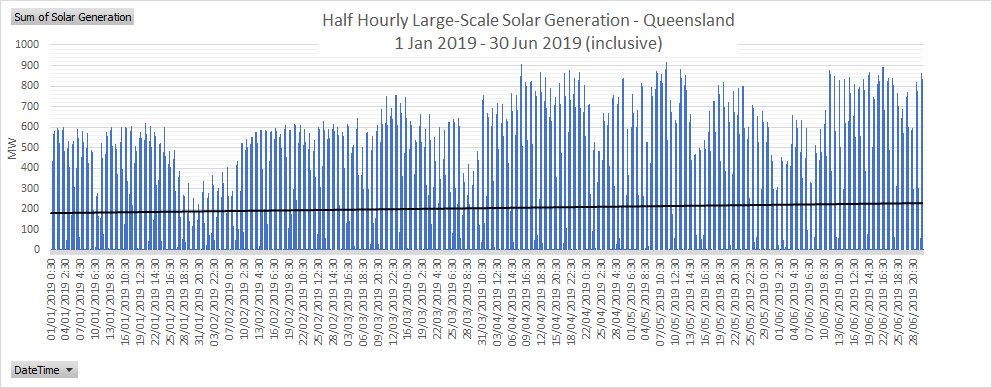
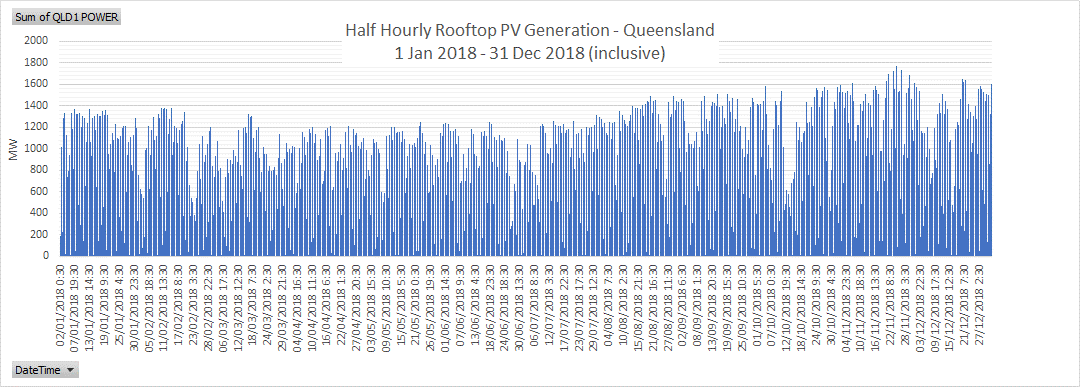
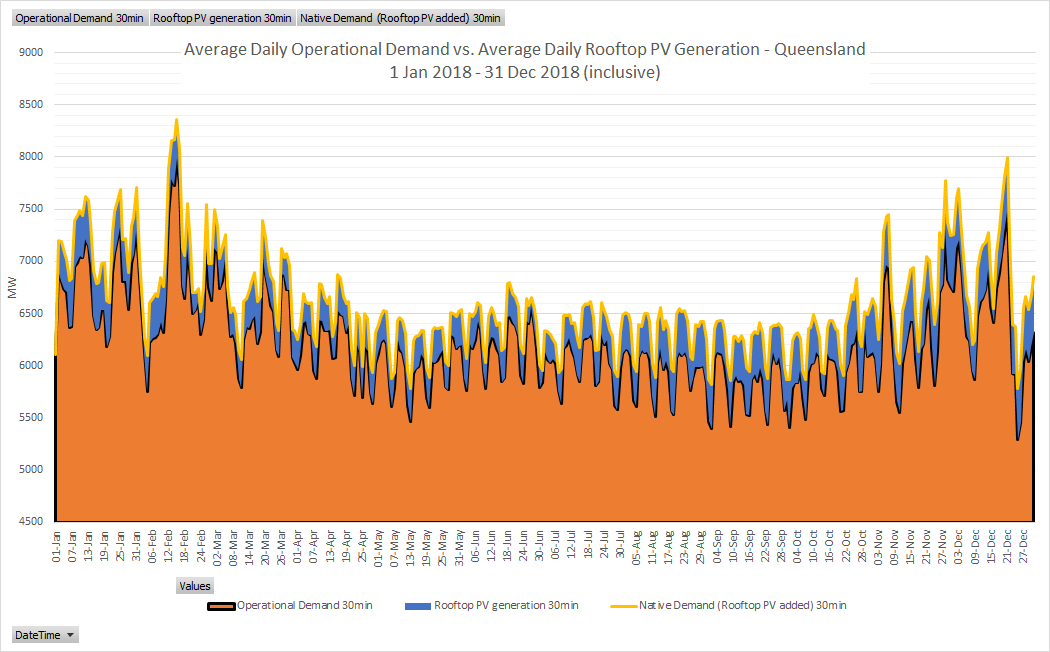
It is no surprise, when I say the National Electricity Market (NEM) is going through a vast transition and transformation, with an ever-increasing penetration of renewable generation, in the form of both utility scale renewable generation and household installations.

The world as we know is also battling the global pandemic that is Coronavirus. This has had a significant impact on people and their livelihoods and health.  along with a significant impact on energy markets around the globe. To top it all off, energy markets have had to endure a supply price war recently, between OPEC’s unelected leader, Saudi Arabia and non-OPEC oil producer, Russia.

With a rapidly evolving and ever-changing energy landscape, what should our contract markets look like? Are the current products fit for purpose or offer value in an energy landscape like the NEM? As a generator, the days of capturing value and running flat out all hours of the day, are indeed starting to dwindle, with quick, nimble, and easily dispatchable fast-start generation likely to excel in the near to longer-term landscape. Take South Australia (SA) as a good example, as to the success of fast-start plant. On the 04/04/2020 at 12:00pm, the 5 minute spot price was down at -$1,000/MWh, which is where it stayed the majority of the morning, due to low demand and strong generation, trying to send megawatts into Victoria (VIC), maxing out the interconnector. Shortly after that, at 12:20pm, prices spiked to above $300/MWh for the next 30 to 40 minutes or so, with fast-start gas generation swooping in and capturing this short-term high price period.

If this type of generation is the key to success in this new look NEM that we operate in, where fast-start, short burst generation is taking its place to complement the intermittent renewable generation in wind and solar, utility or household, that continues to penetrate the market, why are our contract markets continuing to predominantly offer baseload swaps?

A baseload swap is a contract for energy, say 5 MW for $70/MWh, for a defined period, for a month, a quarter, a calendar, or financial year. The way a swap works is the $60/MWh becomes the strike price in which the seller of the swap pays the floating price (the price of the underlying wholesale product which is electricity in this instance) and the buyer pays the fixed $70/MWh.

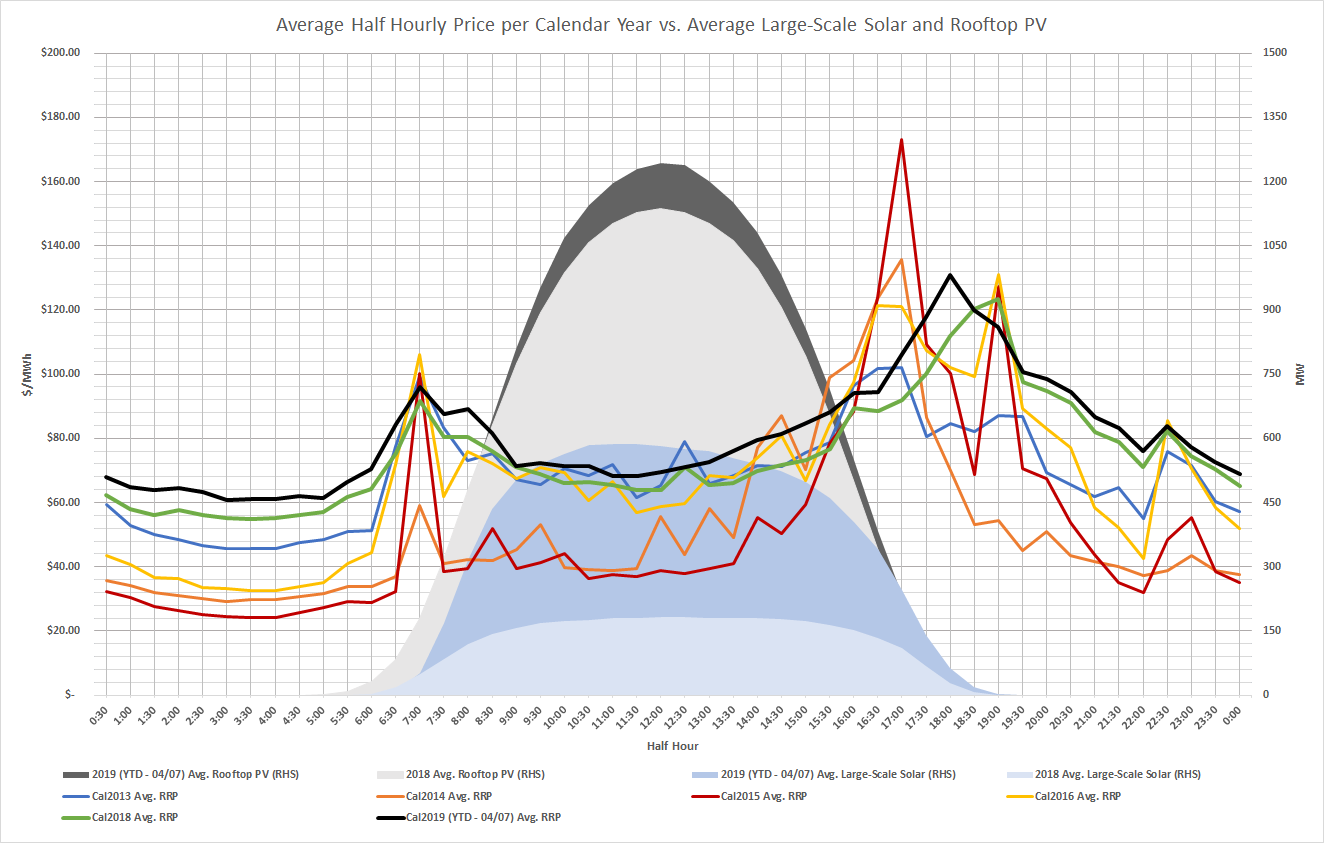
Say you have contracted a baseload swap for 5 MW for the entire calendar year of 2020, this would mean that for every half hour (with electricity settling every half hour as per the underlying wholesale market settlement regime in the NEM), of the entire 2020 calendar year, the buyer will pay the seller $70/MWh, and the seller will pay the buyer the underlying wholesale or spot price. For example, say this morning the wholesale or spot price for electricity for the half hour ending period of 9:30am was $40/MWh; this would result in the buyer paying the seller $70/MWh for 5 MW, whilst the seller would pay the buyer $40/MWh for 5 MW, resulting in a $30/MWh contract for difference (CFD) payment going from the buyer to the seller.

However, think about this, the baseload swap is exactly that, baseload. So, a contract for calendar year 2020 means you are locked into that same position (unless you sell out of the position) 24 hrs, 365 days.

So, do baseload contracts offer appropriate value anymore, in a market which are short-lived upward volatility and recently longer periods of downward volatility?

Mid last month, Snowy Hydro struck a contract defined as a ‘super-peak’ swap, which will cover what has been defined as the “super peak” periods of the day, generally morning and evening peak usage when solar is ramping up or down. The trade was brokered through an over-the-counter (OTC) trading hub operated by Renewable Energy Hub, and it is believed, similar deals will be a gateway to funding and bringing into the market technology such as batteries and demand-response into the energy markets.

Snowy Hydro has been procuring renewable PPA’s for a while, through wind and solar generation, including the 90 MW it procured from the Sebastopol Solar Farm in NSW. They are looking to use the renewable generation and back it with their significant hydro fleet, to sell a new range of products to its customers.

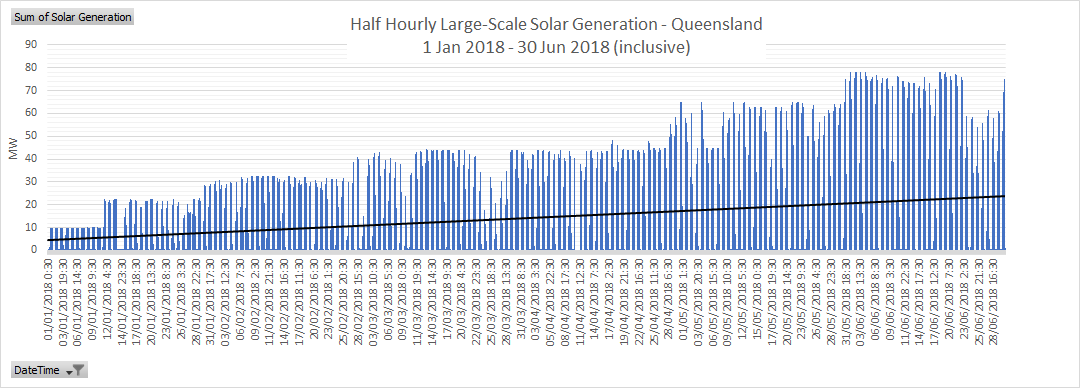
With wholesale energy prices reducing significantly since September 2019, and the overabundance of generation in states such as QLD and SA, and with the rapid introduction of new technology, it is likely a significant number of customers will choose to take more wholesale/spot price exposure, rather than contracting ahead of time.,

This fuels the argument for the need to have more flexible and robust products, ones that are for particular trading intervals, perhaps in the day, day-ahead products, week-ahead products, or perhaps more products like Snowy’s ‘super peak’ product?

If you have any questions regarding this article or the electricity market in general, call Edge on 07 3905 9220 or 1800 334 336.

What’s Oil got to do with it?

There is no doubt that energy markets and the energy industry itself are rapidly evolving and moving away from fossil fuels. The evolution of energy seems to be coming, and only coming faster given this tumultuous time the people and countries across the world have endured. Lets start with oil; Australian’s across the nation are very aware of the recent global oil price crash to new historic levels, particularly when it is reported in the news headlines that Australian’s are seeing almost 15-year lows at the petrol bowser. The impact of the recent oil price crash however does not stop at the bowser, it has and will continue to have significant impacts on energy markets across the globe including in Australia.

Oil prices have been hit recently due to two major events; one being the global epidemic of COVID-19, resulting in a significant reduction in demand for oil across the globe. The International Energy Agency’s (IEA) April 2020 reports an expected drop in demand of global oil of 9.3 million barrels(mb)/day year on year for 2020, with April 2020 demand estimated to be lower than 2019’s demand by 29 mb/day. The second impact to oil markets has been the oil price and supply war between OPEC’s pseudo leader Saudia Arabia and non-OPEC nation, Russia, two of the largest global oil exporters. Saudi Arabia and Russia could not agree levels of supply, leading to Saudia Arabia flooding the market with oil and prices, both spot and futures, reaching new lows. The quarrel between the two global oil market power-houses and the impacts of the COVID-19 on demand for oil has led to the historical event where the West Texas Intermediate (WTI) oil price index fell into negative price territory, with May 2020 future prices settling at -USD$37.63/barrel on the 20/04/2020, after reaching a low of -USD$40.32/barrel earlier that day.

The major oil index, WTI, saw futures prices for June 2020 contracts settling at around USD$17/barrel on the 29/04/2020, whilst Brent Crude, another major oil index also felt the pain of slowing demand, with prices dropping below USD$20/barrel on the 27/04/2020. But the impact of tumbling oil prices reaches far and wide, particularly here in Australia. Australia has a booming natural gas industry and was the largest exporter of liquified natural gas (LNG) as of January 2020. A significant number of gas sales agreements are linked to the crude oil indices, with Australian gas companies feeling the hurt given the tumble in oil prices. Brent Crude oil futures for June 2020 contracts settled at around USD$24/barrel on the 29/04/2020. At these prices, the likes of Santos and Oil Search will be hurting given both flagged a cashflow breakeven oil price of ~USD$25-29/barrel, and USD$32-33/barrel, respectively. Demand for natural gas in international markets has also tumbled, and due to the linkage between oil prices and gas contracts, spot contract prices have shifted down, with June 2020 contracts settling at AUD$2.87/GJ (~USD$1.88/GJ) as of the 30/04/2020, again a far reach from prices seen in November 2019 of ~AUD$7.30/GJ (~USD$5/GJ).

Further impacts of the oil market crash on gas markets has been cheaper domestic gas prices for consumers. Queensland, the largest gas extractor and exporter on the east coast has seen prices in its short-term trading market (STTM) in Brisbane reach as low as AUD$2.31/GJ in March 2020, a significant drop from AUD$9-11/GJ we witnessed the same in 2019. Other energy commodities have also seen a decline off the back of the oil price tumble, including thermal coal. As stated above, with gas prices domestically and internationally falling away, thermal coal prices have come off due to energy users opting for cheaper fuel sources such as oil and gas. Spot thermal coal contracts for the May 2020 settled at USD$52.35/metric ton(mt) on 30/04/2020, far softer than spot prices a year ago at ~USD$90/mt.

This brings us to the all-important energy market and commodity, electricity, which with all the above combined has seen electricity prices fall off a cliff. The National Electricity Market (NEM) in the last few years has been on a renewable power growth spurt. Queensland for instance has the highest penetration of large scale solar generation of approximately ~2,400 MW and a significant penetration of rooftop solar reaching ~2,100 MW, combine them together and on a mild April day in 2020, you have almost 2 thirds of maximum demand. With renewable energy displacing thermal/fossil fuels, off the back of reducing pricing for the technology and subsidies in the form of renewable energy certificates (RECs), combined with both far cheaper gas prices allowing gas plant to bid in and capture price spikes due to their fast-start and intermittent operating capabilities, and reduced demand for electricity due to the impact of COVID-19 with business and industry operating skeletally, electricity prices continue to sit at prices not witnessed since 2016.

All the above has been caused by two events, both significant to the global economy, and the energy industry in their own rights. One thing is for sure, the events have helped push the electricity market on the East Coast of Australia into a new direction far quicker than it may have if the two COVID-19 and the oil price crash did not occur. We are seeing new market design concepts (ie. capacity markets, two-sided markets) and new contract market products (ie. super-peak swap) coming to light, that give way to new technologies and greater competition. The abundance of natural gas in Australia is affordable for households for heating and is finally being utilised as the ‘transition’ or bridging fuel it was always pegged as, to renewable energy in the wholesale market. One thing is for certain, change is afoot, and it definitely has me excited.

If you have any questions regarding this article or the electricity market in general, call Edge on 07 3905 9220 or 1800 334 336.

COVID-19 / NEM Impact Statement

COVID-19 has impacted us all in recent weeks. At Edge we have put plans in place that have allowed us to provide all services our clients require without disruption.

We are working diligently to understand the impacts COVID-19 could have on the energy markets in the short and longer term. As more information comes to light, we will provide further updates on the impacts to the market and our clients.

As we are only a few weeks into this pandemic we will try and provide an understanding of the impact COVID-19 could have on the market.

Oxford economics, a team of 250 economists, has recently published a paper providing a high-level update on the impact of the pandemic on the world economy. Their initial work predicts a short, sharp recession to the global economy with major national economies going into deep recession during the first half of 2020. It is modelled that over the full year global growth will drop to zero.

Oxford economics are predicting, based on historic experience, a strong bounce back in activity once social distancing measures are relaxed. It is forecast that businesses that can get through the first half of 2020 should be prepared for a strong second half of 2020, with global growth forecast above 4%.

Overseas experience

As China was the first country to close-down as a result of COVID-19 we can learn from their recent energy experience and translate it into the Australian market.

In January and February energy production dropped significantly with thermal power dropping 8.9%, hydro dropping 11.9% and nuclear and wind dropping to a lesser extent at 2.2% and 0.2% respectively. On the flip side Solar generation increase by 12%.

Early indications are that thermal and hydro station dropped production the most due to reduced staffing level causing lower operational hours. Renewables were impacted the least due to their non-dispatchability.

It is estimated that during the height of the Chinese lockdown period over the 27 days, demand decreased by 16%.

At Home in Australia

Generation

Large generation portfolio’s including the likes of Stanwell and AGL have publicly acknowledged they have put plans in place to ensure generation meets demand, this includes stockpiling coal to ensure security of fuel supply. Smaller generators on the other hand may not have the staff to guarantee operation of their units over the long term due to illness.

Energy Price Impacts

With the additional impact of lower energy demand in Asian countries such as China, Australia’s liquefied natural gas demand significantly reduced, resulting in excess domestic gas supply particularly on the east coast of Australia. Although majority of the LNG facilities on the east coast reside in QLD, we have seen an increase in gas generation and a decrease in bid prices in regions more dependent on and abundant with gas-fired generation, such as South Australia. We are seeing approximately 600 MW more of gas-fired generation in March 2020, compared to March 2019, bid in at prices below $50/MWh. Assisting this is the collapse in natural gas prices in the Adelaide Short-term Trading Market, which has traded at the mid to high $5/GJ range for March 2020, compared to the significantly higher price range of $10 – $11/GJ we witnessed back in March 2019. Both of these variables are introducing cheaper supply in the energy markets both for heating (in homes) and electricity generation. With interconnection remaining relatively unconstrained this is resulting in lower prices across all NEM regions.

AEMO

AEMO has put in place its pandemic response plan so the market operator can continue to operate the NEM and WEM efficiently and safely. Key actions in the pandemic plan include limiting contact with key staff such as control room and other business critical staff.

Demand

Following the initial breakout of COVID-19 in Australia and the early shutdown of some businesses, demand fell by about 600MW in NSW or about 8% of average demand. This was reflective of all states. Over the recent week the steep reductions in demand experienced at the start of COVID-19 have flattened out as a result of two possible reasons. In some regions such as Victoria, demand has increased. The first reason for this change in demand is consumption has moved from businesses to individual homes. Across Australia average demand is currently only 7% below last month’s average. The demand change is also attributed to seasonal change which has resulted in a reduction in load associated with cooling.

Change in demand – daily profile

The chart below illustrates the change in demand across the day and compares a summer profile and a transition to an autumn profile. The top line is early February with the bottom-line showing demand from Monday the 23rd March.

Source: AEMO 2020

The chart shows morning peak has reduced slightly however the demand over the evening peak has dropped significantly.

Impact of large users

It is expected that large users would be impacted significantly by the virus however this does not appear to be the case. With parts of the world such as South Africa shutting down mines and industry following government direction the supply / demand balance is falling in the favour of Australia. Add to this the favourable exchange rates, the export potential of commodities from Australia remains strong. The Australian mining industry is also designated as an ‘Essential Service’ so at this stage they are sheltered from future lock downs. This positive news for the mining sector which will benefit mining rich states with demand expected to reduce to a lesser extent than other states.

Renewables

If the trends overseas are reflected in Australia the current installed capacity of renewable generation will continue to operate at strong levels providing staffing is available to operate and control the assets.

There will be a likely slowdown in the development of renewable projects as a result of the restrictions on travel, meetings and specialist staff available for construction, connection, commissioning and final approvals.

This slowdown will impact the future mix of generation assets across Australia, the current trend in carbon emission reductions and the supply and price of environmental products.

LGCs

Edge has modelled the impact of a 10% reduction in demand with a business as usual generation profile for large scale renewable generators to understand the impact this downturn may have on LGC supply and price.

The 10% reduction in demand could reduce the RPP percentage by 0.32%. The likely effect of a reduced percentage and business as usual renewable production will be surplus LGCs in the short term and reduced prices for LGCs.

STCs

With the downturn of the economy it is expected that less roof top solar will be installed resulting in a reduction in the current surplus of certificates carried forward since 2017. The reduction is expected to reduce the STP below 20%.

If you have any questions regarding this article or the electricity market in general, call Edge on 07 3905 9220 or 1800 334 336.

South Australia separated from the NEM!

The South Australian (SA) region has been separated from the remainder of the NEM regions due to the destruction of the main alternating-current (AC) interconnector between SA and Victoria (VIC).

What occurred:

  • On the 31st of January 2020 during wild storms that lashed eastern SA, western VIC, the 500kV main (AC) interconnection cable running through southwestern VIC was disconnected due to transmissions towers east of Heywood (Victoria) and west of Geelong (Victoria) collapsing in damaging storms and extremely strong winds.
  • When this occurred,
    • Interconnection flows quickly swung from exporting MW’s into VIC, to importing MW’s into SA.
    • Alcoa’s Portland aluminium smelter tripped which only exacerbated the problem,
    • A handful of wind farms were cut off from the market including McCarthur Wind Farm (420 MW) in Victoria, and the three Lake Bonney Projects in South Australian (~278.5 MW)

What does this mean:

  • Basically SA has been left to fend for itself, cut-off from the rest of the NEM
  • All MW’s (majority of all, with the small Murraylink direct-current interconnector still available) and frequency control services must be sourced from SA, locally.
  • Currently all SA generators are running hard and optimising portfolio’s for frequency control services (FCAS) prices rather than regional reference prices (spot price)
  • Additionally, a vast majority of gas-fired generation units including, Osbourne GT, Pelican Point, Torrens Island A and B units have and continue to receive market intervention notices from AEMO requiring them to be online
    • This is adding to the oversupply in the region with wind generation quite strong for this time of the year,
    • Not to mention, the wind generation, being a variable generation type, is not helping from a forecast perspective for AEMO, adding to the FCAS costs and requirements in the SA region.

Solution:

  • AEMO have indicatively provided a two week return time off the back of AusNet’s (interconnector owner) initial assessment and action plan to fix the interconnector.
  • AusNet’s solution is to construct temporary interconnection with power poles and lines to have arrived on site yesterday (03/02/2020).

Current weather forecast and impact on spot price:

  • Currently temperatures are set to be relatively mild for an SA summer at this stage.
  • However, temperatures are expected to reach the late 20’s and early 30’s towards the end of the week, historically, temperatures at these levels have encouraged higher demand and the need for imports from VIC, which will not be possible with the largest interconnector between the two regions out of action.
  • Although we are seeing some extreme lows in spot price, there is the possibility we could see some extreme highs. It is dependent on:
    • AEMO’s intervention in the market with AEMO issuing FCAS targets to participants in the realm of $300/MWh for raise and lower services (due to the inability to source FCAS from outside of SA), and
    • Generators potentially looking to spike spot prices or increase the spot price with no doubt, gas generator running costs no doubt increasing every MWh the interconnector is out of action.

If you have any questions regarding this article or the electricity market in general, call Edge on 07 3905 9220 or 1800 334 336.

World Economic Forum – EU’s proposed carbon border Tax

The World Economic Forum was held late last week in Davos (Switzerland) with foreign leaders all around the globe coming together to talk about the global economy and hopefully generate some fruitful action.

Probably one of the more market shifting proposed schemes put forward at the World Economic Forum was that of European Commission President, Ursula von der Leyen. Von der Leyen’s proposal is a daunting one from Australia’s point of view, as it could have a significant impact on the country’s vast economic dependence on exportation of minerals and goods.

The proposed scheme, labelled the ‘carbon border adjustment mechanism,’ would be a tax applied to carbon-intensive good from those countries that are not pulling their weight as to lowering emissions under the Paris climate accord.

The economy likely to feel the brunt of this proposed tax-scheme would be China, with the scheme’s proposed first target industries being steel, cement and aluminum. Von der Leyen did however message the scheme could expand into the mining and resources sectors.

Although Australia’s most prominent trade partner in the resources sector is China, Europe was a big receiver of coal exports from Australia in 2019 and could very well be in the firing line with constant debate between Australian politicians and other world leaders as to whether Australia is indeed pulling their weight per the Paris agreement.

If you have any questions regarding this article or the electricity market in general, call Edge on 07 3905 9220 or 1800 334 336.

Semi-scheduled and Intermittent Non-scheduled Generators urged to advise of De-ratings

A new market notice within the National Electricity Market (NEM) posted by the Australian Energy Market Operator (AEMO), one we have not see before was issued to all market participants on the 23/12/19. The market notice requested and served as a reminder for all semi-scheduled and intermittent non-scheduled generators to ensure they update their market availability bids, update their SCADA Local Limit or, if unavailable, advise AEMO control room to implement a quick constraint to the reduced available capacity level; and update intermittent generation availability in the EMMS Portal to reflect reduced plant availability as is required under the National Electricity Rules (NER), per NER 3.7B(b).limits.

This was an interesting constraint for AEMO to issue as it was due to extreme heatwave conditions across the south east coast of Australia, and as with most generating plant, under extreme heat, some form of derating on its physical capacity and output can occur. On the 23/12/19 AEMO’s weather service provider was forecasting extreme high ambient temperatures across all NEM regions, hence AEMO’s market notice to these participants to remind semi-scheduled and intermittent non-scheduled generators to advise AEMO of any reduction in available capacity caused by temperature derating.

Particularly interesting is that the often “set and forget” approach to renewable generators such as solar and wind generators, as classified by AEMO as semi-scheduled generation is being watched with greater scrutiny, particularly after the events of 2016 in SA where a state wide blackout was triggered by a severe weather, damaging more than 20 towers, downing major transmission lines, and with multiple wind farms currently shouldering some of the blame for the state going black due to the wind farms switching off when the transmission lines went down.

Semi-scheduled: A generating system with intermittent output (like a wind or solar farm), and an aggregate nameplate capacity of 30 MW or more is normally classified as a semi-scheduled generator unless AEMO approves its classification as a scheduled generating unit or a non-scheduled generating unit. AEMO can limit a semi-scheduled generator’s output in response to network constraints, but at other times the generator can supply up to its maximum registered capacity (AEMO 2014).

If you have any questions regarding this article or the electricity market in general, call Edge on 07 3905 9220 or 1800 334 336.

High solar generation vs spot prices in Queensland

Alex Driscoll, Manager Wholesale Clients and Markets

Solar generation and its impact on spot price is a topic of major discussion, particularly in the ‘Sunshine State’ of Queensland where there is a continuous pipeline of solar generation development. This raises the question: is strong solar generation having an impact on spot prices, and if so, is it lowering or increasing prices?

Increasing Large-scale Solar Penetration in the NEM

It is no secret that solar generation has increased dramatically over the last 12-18 months. From 1 January 2018 to 30 June 2018 (inclusive) the average daily production of large-scale solar generation in Queensland was only approximately 14.2 MW, only accounting for 0.085% of total Queensland generation.

(Source: AEMO)

For the six months between 1 July 2018 to 31 December 2018 (inclusive), the average daily production of large-scale solar generation in Queensland increased to 125.3 MW and accounted for 1.9% (an increase of > 1% on the previous 6 months) of total Queensland generation during that period.

(Source: AEMO)

Fast forward to 2019, and generation volumes from large-scale solar generators has continued to increase, reaching a maximum of 917 MW on 08/05/2019 at 11:30. From 1 January 2019 to 30 June 2019 (inclusive) the average daily production of large-scale solar generation in Queensland increased to 205.6 MW and accounted for 3% (an increase of an additional 1% on the previous 6 months) of total Queensland generation.

(Source: AEMO)

The Rooftop (Photovoltaic) Reckoning

So far, we have only evaluated large-scale generation and its penetration in Queensland, however there is another solar photovoltaic beast infiltrating the NEM, namely Rooftop PV (small-scale home and business installations). If we look at similar timelines, home and business owners are deciding to take more control of where their energy comes from, with multiple household and business rooftops opting to install solar panels on what would be wasted space (and opportunity). It is important to understand, rooftop PV falls within AEMO’s (Australian Energy Market Operator) category of distributed energy resources which is subtracted from native demand to determine operational demand.

The general trend for rooftop PV is that its contribution to the energy mix is growing constantly. The maximum volume between 1 January 2018 to 30 June 2018 (inclusive) reached 1.4 GW, with the period 1 July 2018 to 31 December 2018 (inclusive) recording a maximum of 1.78 GW. That is an increase of almost 400 MW in six months. On average, rooftop PV reduced native Queensland demand by 345 MW each day on 30-minute demand figures across the entire 2018 Calendar Year.

(Source: AEMO)

(Source: AEMO)

Roughly year-to-date, we have not seen the same strong performance from rooftop PV. However, summer 2020 could provide a new rooftop PV maximum for Queensland and NEM wide with the Australian Photovoltaic Institute recording on average for the period of 1 January 2019 to 31 March 2019 (inclusive), an additional 16,200 reported installations.

(Australian PV Institute Solar Map, funded by the Australian Renewable Energy Agency, accessed from pv-map.apvi.org.au on 4 July 2019)

Impact to Spot Price

As the graph below depicts the calendar year, daily average half hourly pricing from 2013 to YTD 2019 (excluding 2017 as an outlier with bidding direction from Queensland government to GOCs). Despite the growth and increase in both average (half-hourly) rooftop PV and large-scale solar generation, spot prices have also increased. This is not to say that solar is to blame for the increase in prices, as price has not increased in all hours of the day.

To summarise the changes:

  • The morning peak has remained roughly the same across the years with a sharper ramp-up depicted in earlier years.
  • Evening peak has shifted further into the evening than earlier years depicted and is not as strong.
  • The off-peak hours have become increasingly more valuable in comparison to earlier years.
  • However, the biggest and possibly strangest movement is the daylight hour prices, or solar hours have roughly remained the same (apart from 2014/15).

(Source: AEMO)

We cannot conclusively say that the increase in solar generation is the sole reason for prices heading on an upward trajectory since 2014 (as the table below depicts), however it would be fair to say the increase in solar has played a part in it. The addition of the strong solar penetration has changed the dynamic of the market, causing thermal generators and other fuel types to re-think how they will recover the costs of their 15, 20, 30-year investments. Thermal generators will likely start by displacing the price curve and increasing bids in the off-peak periods. The evidence is clear in that the off-peak periods are now increasingly more valuable than they were 3-6 years ago.

On top of this, a large portion of solar generation is being built north of the Calvale and Wurdong substations in Queensland and is having little effect (unless new infrastructure is built) on middle of the day spot prices. This is due to contingent and operational constraints placed on the power lines by AEMO so as to not overload the lines, forcing generation north of this constraint (solar inclusive) to constrain off. Nonetheless, there are a multitude of factors impacting the price in Queensland and solar generation’s impact on prices should not be overlooked. However, one thing is for certain, spot prices have been increasing since 2014 (see below table) and in the near term show little sign of slowing.

Calendar Year ($/MWh)
QLD 2013 2014 2015 2016 2018 2019 YTD
Avg Spot Price  $    68.41  $    50.91  $    51.96  $    67.32  $    74.82  $    80.64

(Source: AEMO)

If you would like further information on the impact of solar generation, please contact your Manager Wholesale Clients or Edge on (07) 3905 9220.

LNP Inertia Continues

In a surprise outcome the LNP maintained leadership over the weekend noting that it remains unknown whether or not the LNP will form a majority government. Energy and climate were at the heart of this election with Labor putting forward material initiatives that would increase investment in renewable energy generation (increased funding to the CEFC) and reduce emissions through the extension of the safeguard mechanism, amongst a number of other initiatives. The LNP are less ambitious and maintain the emissions reduction target of 26-28% below 2005 levels by 2030. The LNP will extend the Climate Solutions Fund by providing additional funding to the Emissions Reduction Fund which is the reverse auction of ACCU’s managed by the Clean Energy Regulator.

In terms of energy generation and transmission the LNP has pledged support for Snowy Hydro 2.0, the Underwriting New Generation Investment program and Marinus Link (Interconnector between TAS and VIC, part of the Battery of the Nation plan).

The futures markets (energy and environmental certificates) had priced in a Labor victory. The result over the weekend may put upward pressure on forward prices (energy & Enviro) as there will be less new renewable generation invested in over the coming years. That being said, state based renewable energy targets remain in place as per the following:

QLD – 50% Renewable by 2030

NSW – No target

VIC – 25% by 2020 and 40% by 2025

SA – No target

Tas – 100% by 2022

The larger demand states are QLD, NSW and VIC who are still heavily reliant on coal powered generation. NSW is the only state of these three whereby there is no target. Given that QLD and VICs renewable energy targets remain in place there should not be a material decline in new renewable generation development in these regions. For NSW, at least for the time being, new renewable generation will be a function of price. Currently NSW prices are at a level whereby a solar or wind developer should be able to secure funding and a PPA.

If you would like to know more about the potential impact that our LNP government may have on Australian energy prices, please contact Edge Energy Services on 07 3905 9220 or 1800 334 336.

Queensland spot prices – March vs April to date

In Queensland, we have observed lower daytime spot prices since the beginning of April, relative to March averages.

Taking a closer look at half hourly average spot prices seen so far in April, we can see that between 8am and 4pm spot prices have been softer than the same periods in March. Following this, spot prices are higher in the evening peak periods. Whilst it is a very small data set, this is the relationship that many in the market expect to evolve.

Softer spot prices in the day will motivate generators to price more aggressively (price higher) in the evening peak to increase earnings which have been lost during the day.

Should we see this evolution of softer spot prices during the sunlight hours of the day, it will put further strain on the Queensland solar industry which has had several setbacks of late.

In addition, we can observe from the below graph that there has been an increase in generation from utility scale solar, in terms of both peak and average generation. The increase in solar is making more low-cost generation available in Queensland. New generation from these solar plants remains insufficient to meet all demand and therefore, solar is not setting prices.

If you have any questions regarding spot prices or any other matter relating to energy, please contact Edge Energy Services on 07 3905 9220 or 1800 334 336.