After celebrating ten years in business last year, 2018 has been a year of reflection. As founder and Managing Director, I especially have been reflecting heavily on why the business started, how it has become what it is today and, perhaps most importantly, where the business is headed.
One thing I’m very proud of is that the ethos of Edge has been unwavering since inception. Edge was established to deliver value. At the core of every decision we make and everything we do is ensuring large energy users are equipped to achieve superior energy outcomes. Put simply, we do everything possible to provide the tools and means to buy better.
They say you are only as good as your team. If I reflect on that, Edge’s performance is a reflection on the evolution of the team over the past ten years. Attracting and retaining suitable staff is so important in any business. In the energy industry, it is critical. Knowledge, experience and industry-based networks add immense value to the capabilities of our team, and ultimately the outcomes for energy users that entrust us with their portfolios. As a relatively small player in an elite league, we punch above our weight to attract the talent that do justice to our ethos and the portfolios we manage. We do this through a client base that exceeds any other in the market, and by having established a reputation for the core values we adhere. Integrity, honesty, trust, loyalty and respect are so much more than words in a policy document. They are at the heart of everything we do.
The reason for this business is still as relevant as the day it was established. We deliver value, and more than ever we love doing it. We’ve been successful in building a portfolio of top tier clients and establishing ourselves as a respected counterparty amongst the largest of players in our industry. We work closely with the largest retailers, generators, and law firms across the market. And we work directly for some of the largest and most trusted consulting names in the world. Despite all of this, there is no denying that many consumers don’t even know our name. And we want this to change.
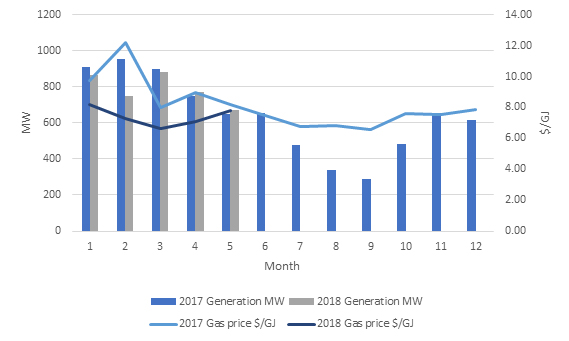
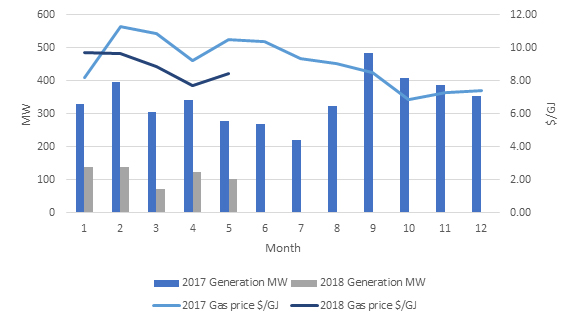
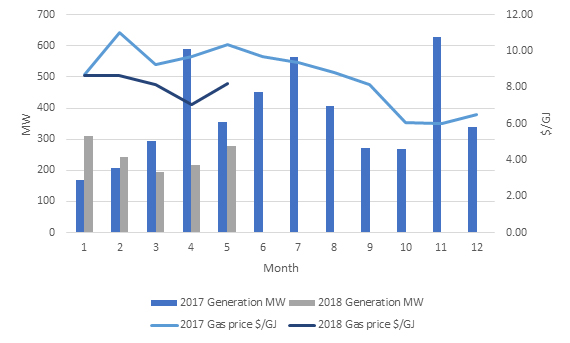
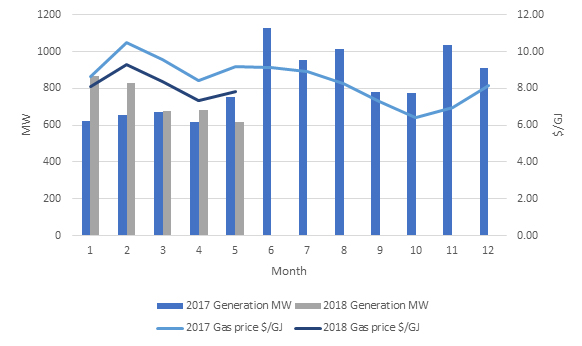
Edge’s services have reached under fifty of the largest names in our market, with approximately 7.5TWh currently under management and over 10TWh contracted in 2018. Our gas portfolio is small in comparison. Looking forward, first and foremost we want to enhance the way we manage this portfolio. Restructuring the team has been a major focus, with a move to offer each client an even deeper pool of skills and experience dedicated to their portfolio. Portfolio Managers who were once tasked with delivering many aspects of a client’s requirements have recently been phased out of the business. Replaced with more senior dedicated managers of wholesale clients for strategic management and dedicated account managers for more transactional services. Each Manager Wholesale Clients will ultimately ensure that their portfolio is being optimised. They’ll be heavily supported by their dedicated Account Manager, our Markets and Advisory team, and our IT team through The Edge Energy Management System (TEEMS) and our customer facing portal (Edge LIVE).
We want to reach more portfolios, and exponentially increase the clients we represent. We want all business energy users in Australia, not just the top tier, to know our name and the immense value our team will bring to their portfolio. Commencing in early 2019 we will invest in dedicated sales personnel to market our services throughout the market. A dedicated BDM will target consumers more suitable for Edge Energy Services’ portfolio, whilst a Channel Manager will be positioned to focus on stand-alone Edge LIVE (BI platform) and Edge Utilities (SME brokerage) services.
Briefly and in closing, our service offering has exploded in recent years, with the development of in-house spot forecasting models, brokerage services on environmental and renewable transactions, and specialist advisory services around FCAS, embedded generation, and generation revenue optimisation strategies. We look forward to outlining these further in the next edition of Edge Insights.
In the meantime, we warmly welcome all feedback on the recent changes to the team and ultimately the management of your portfolio. This feedback is essential to us ensuring you are getting the value we constantly strive for.