In a surprise outcome the LNP maintained leadership over the weekend noting that it remains unknown whether or not the LNP will form a majority government. Energy and climate were at the heart of this election with Labor putting forward material initiatives that would increase investment in renewable energy generation (increased funding to the CEFC) and reduce emissions through the extension of the safeguard mechanism, amongst a number of other initiatives. The LNP are less ambitious and maintain the emissions reduction target of 26-28% below 2005 levels by 2030. The LNP will extend the Climate Solutions Fund by providing additional funding to the Emissions Reduction Fund which is the reverse auction of ACCU’s managed by the Clean Energy Regulator.
In terms of energy generation and transmission the LNP has pledged support for Snowy Hydro 2.0, the Underwriting New Generation Investment program and Marinus Link (Interconnector between TAS and VIC, part of the Battery of the Nation plan).
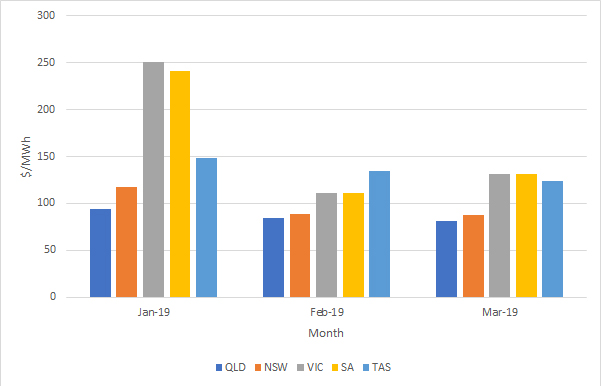
The futures markets (energy and environmental certificates) had priced in a Labor victory. The result over the weekend may put upward pressure on forward prices (energy & Enviro) as there will be less new renewable generation invested in over the coming years. That being said, state based renewable energy targets remain in place as per the following:
QLD – 50% Renewable by 2030
NSW – No target
VIC – 25% by 2020 and 40% by 2025
SA – No target
Tas – 100% by 2022
The larger demand states are QLD, NSW and VIC who are still heavily reliant on coal powered generation. NSW is the only state of these three whereby there is no target. Given that QLD and VICs renewable energy targets remain in place there should not be a material decline in new renewable generation development in these regions. For NSW, at least for the time being, new renewable generation will be a function of price. Currently NSW prices are at a level whereby a solar or wind developer should be able to secure funding and a PPA.
If you would like to know more about the potential impact that our LNP government may have on Australian energy prices, please contact Edge Energy Services on 07 3905 9220 or 1800 334 336.