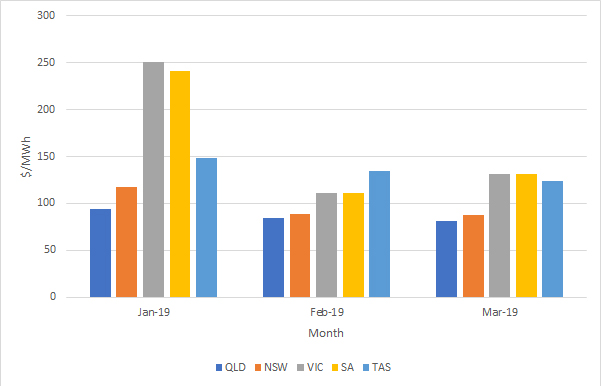
The electricity spot prices in Q219 (April to June) were unsurprisingly lower than the preceding 3 months of Q119 (January to March). Although Q219 experienced some volatility, this was far from the extremes we saw in Q119 with VIC and SA hitting the market price cap in February.
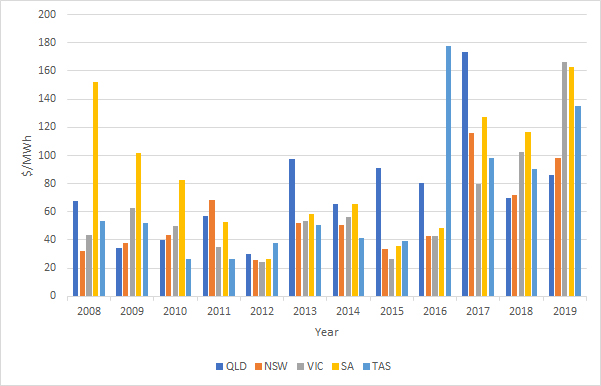
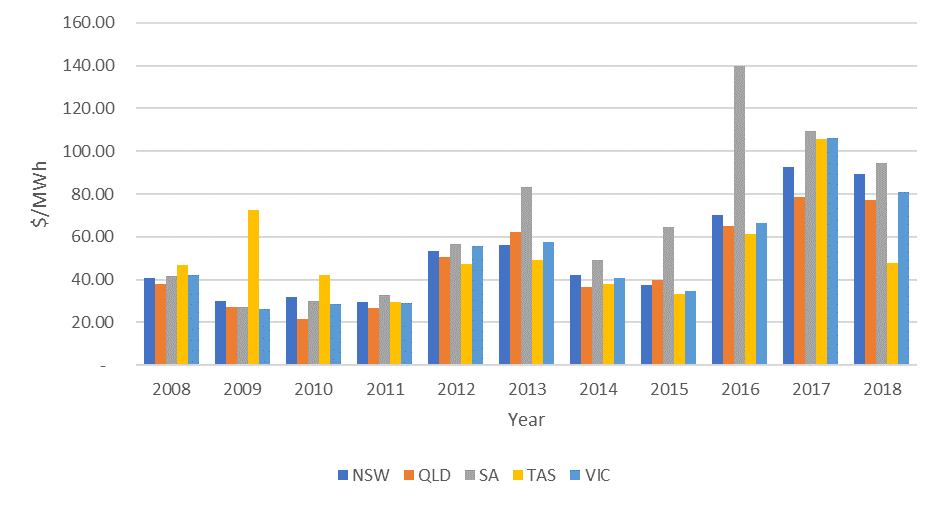
Prices during Q219 were higher than Q218 in QLD, VIC and TAS, however lower in NSW and SA. Looking back across the last 10 years, prices have been higher for all regions.
Figure 1: Historical prices for autumn
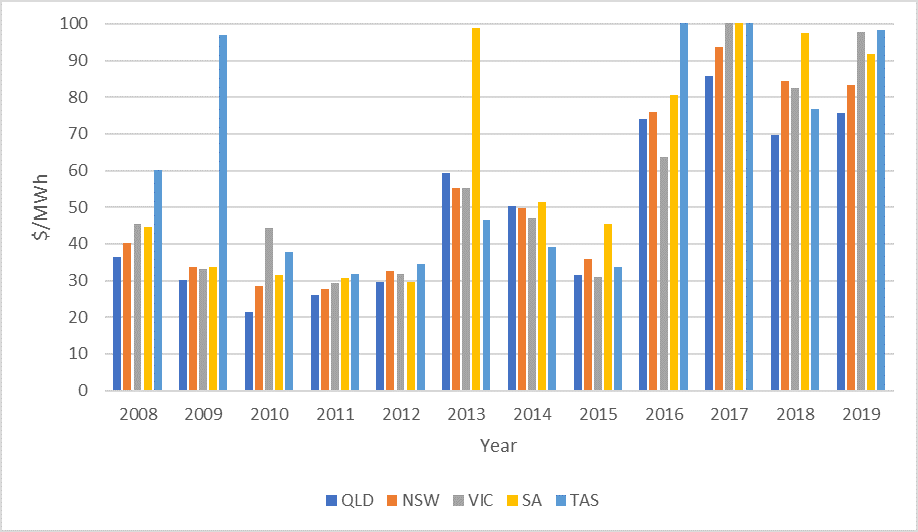
(Source: AEMO)
It should be noted that prices in both 2012 and 2013 were affected by a carbon tax, which was subsequently repealed in 2014. Since 2015 there has been a steady price increase in all mainland NEM regions. In Queensland, the Government provided a direction to Stanwell Corporation and CS Energy to adopt strategies to reduce wholesale prices. Since the direction, there have been fewer price spikes (prices above $300/MWh), although average prices have continued to increase.
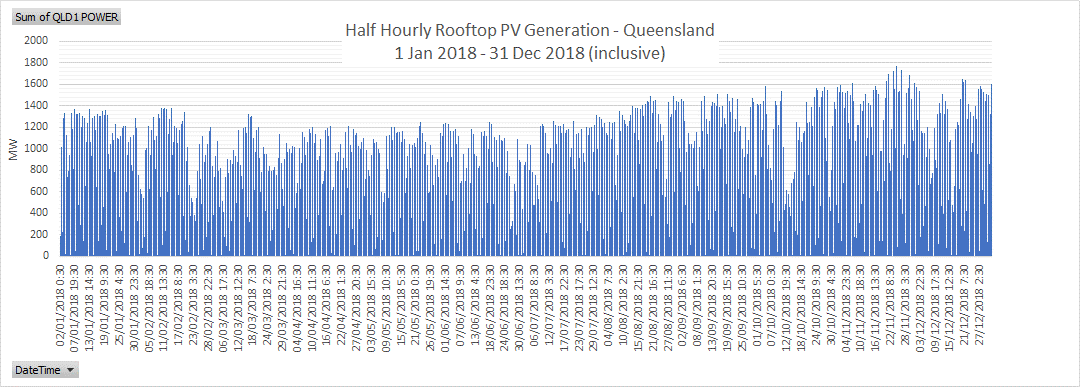
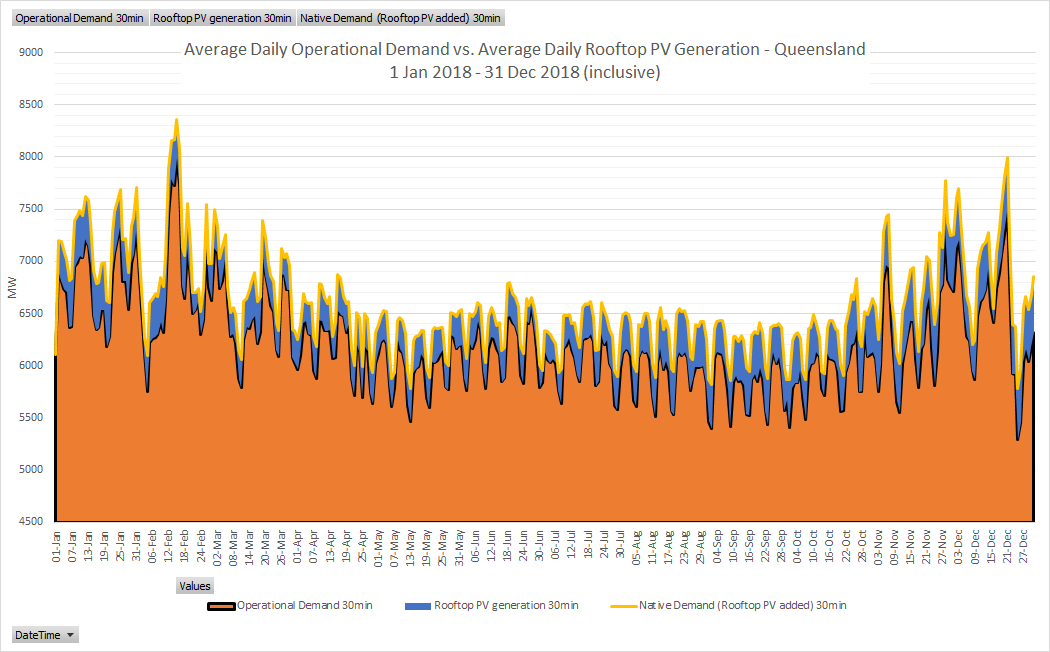
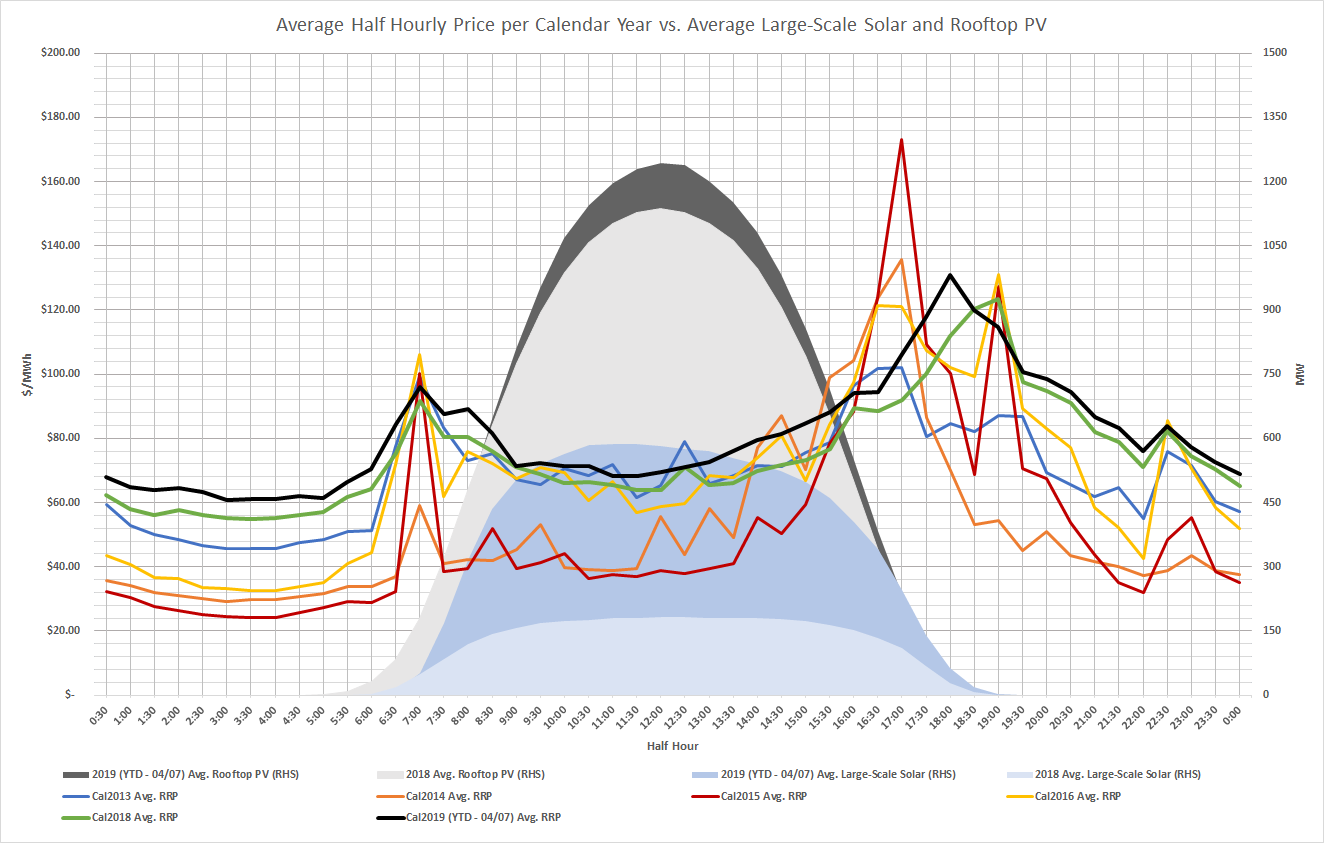
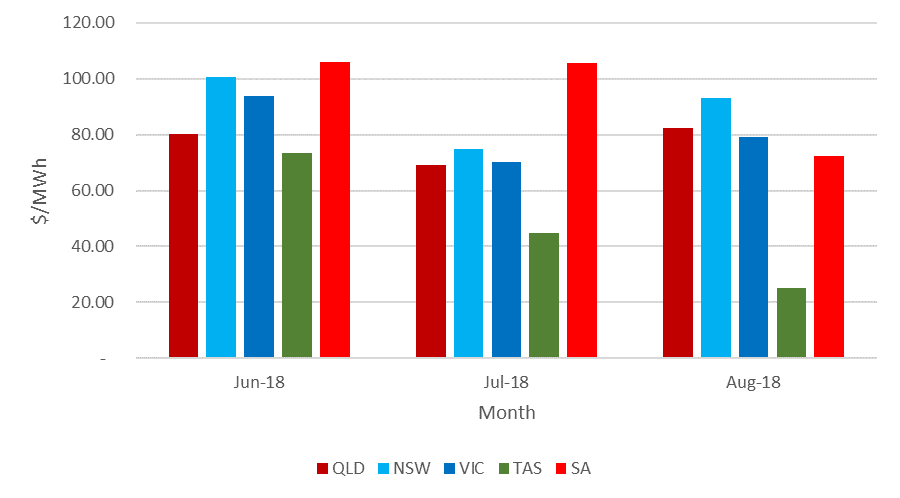
Spot prices and volatility were low during the first part of Q219 as a result of high availability, low demand and generators bidding volume in low price bands. By the end of May, peak daily price increased as a result of operational demand increasing. This stems from rooftop PV rolling off and increased use of household appliances. Spot prices continued to increase through June as both rooftop PV and commercial solar were impacted by shorter daylight hours and intra-regional constraints. NSW price increases were primarily driven by demand increases attributed to colder temperatures.
Snowy Hydro continues to draw down its dam levels to cover cap contracts and supress prices below $300/MWh.
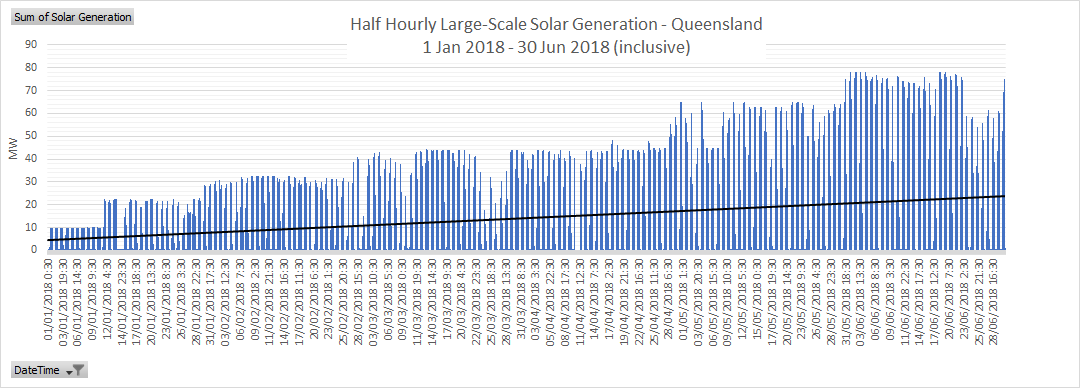
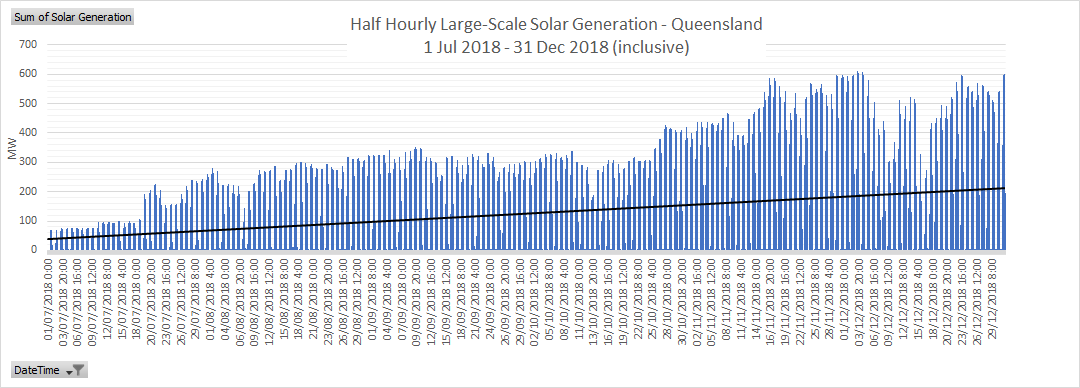
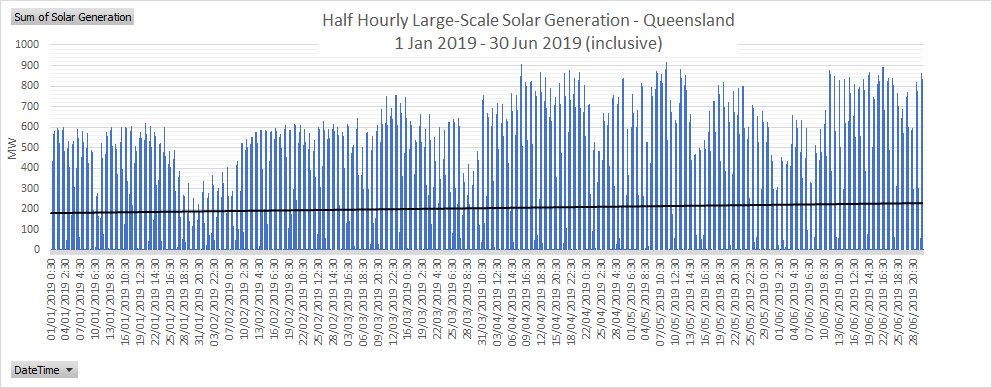
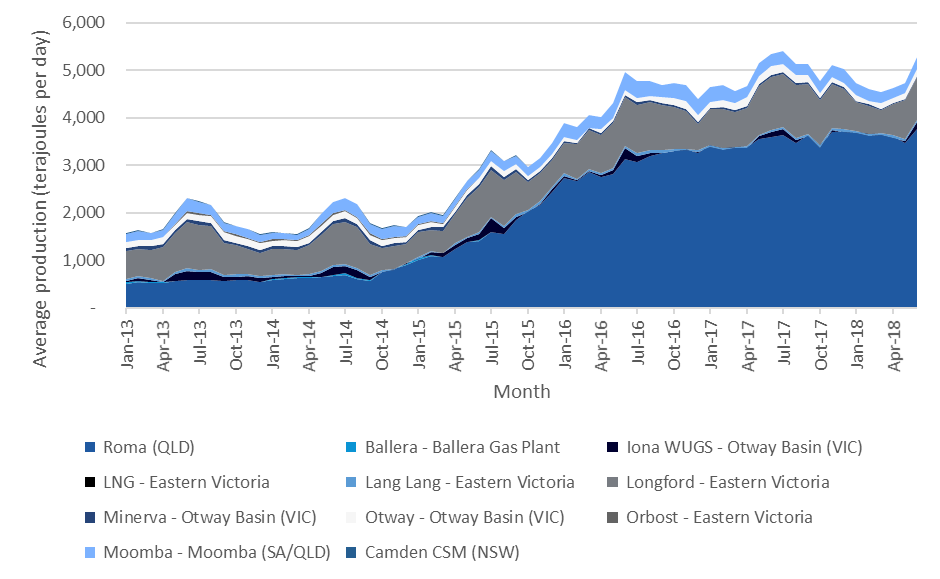
Q219 saw an increased level of generation from gas powered generators. Renewable generation increased by 66% to over 3GW from the start of the year. Operational demand continues to drop as a result of a reduction in energy intensive industries, energy efficiency and the increased uptake in rooftop PV.
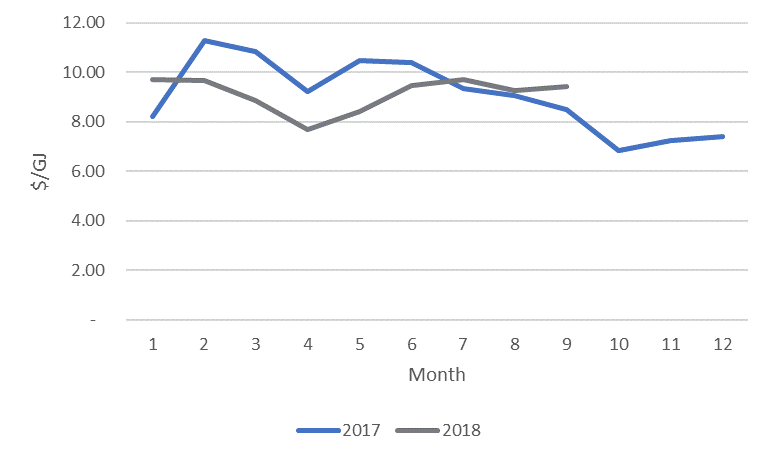
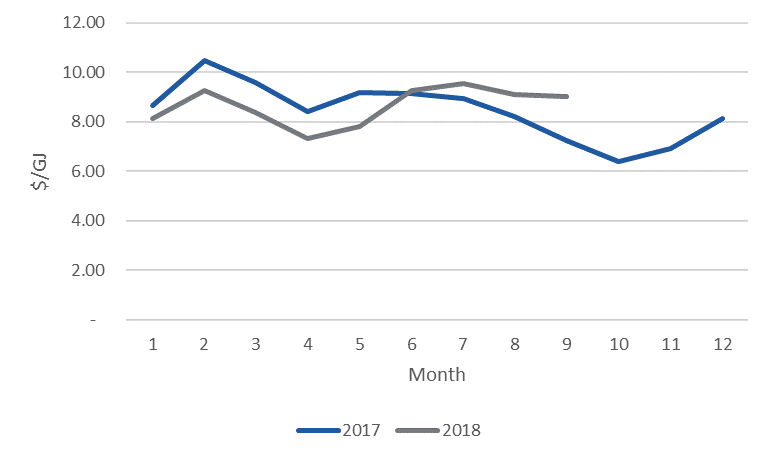
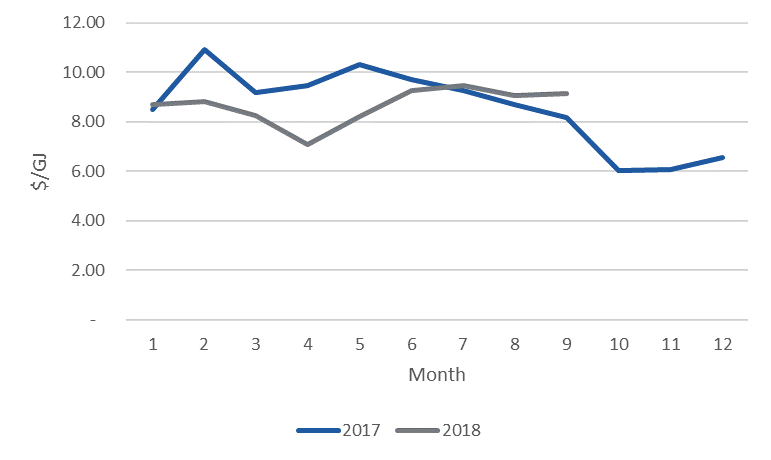
Figure 2: Average monthly spot prices in the NEM
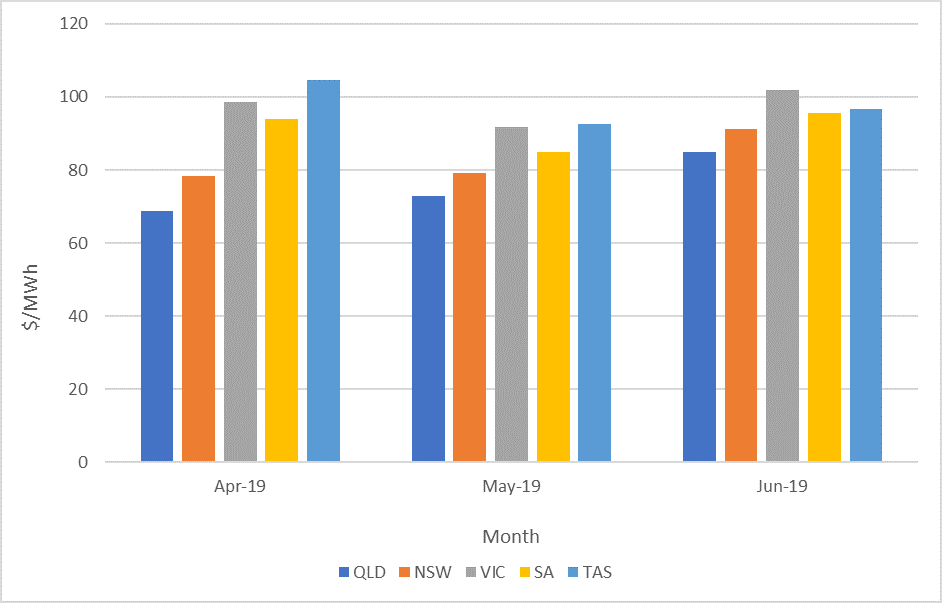
(Source: AEMO)
The Market Operator issued various directions to participants in SA during Q219 to maintain the power system in a secure operating state. Synchronous generating units were directed to operate or remain synchronised to maintain power system security.
Coal fired generation continued to reduce, with the lower level of generation driven by unit outages and the increase in market share from renewables. Hydro generation consistently increased over Q219 despite low dam levels in NSW, VIC and TAS. Increased generation from wind also continued over the quarter.
Higher spot prices and concerns over the stability of the grid have caused the forward curve to increase. Snowy Hydro continued to draw down on its dam reserves and with a dry outlook, the inflows could be lower than previous years
Looking forward
Figure 3: Calendar year 2020 forward contracts
| $/MWh | NSW | QLD | SA | VIC |
| 04-July-19 | 83.72 | 73.00 | 97.00 | 101.00 |
(Source: ASX)
There is currently a large pipeline of committed projects waiting to enter the market. These projects are mainly renewable energy, diesel and batteries. Recent updates to the MLFs may reduce this pipeline. The integration of renewable energy generation into the market and the strategies of price setting coal and gas generation will determine if prices will reduce or if a more volatile market will be created. It is unlikely in the near term that spot prices will return to historical levels as renewable generation has not reached a level to consistently set prices at lower levels.
If you would like to discuss the electricity market outlook and potential impact to your electricity portfolio, please contact our Manager Wholesale Clients and Markets, Alex Driscoll on 07 3905 9220.