AEMO adds to the spooking of the Energy Market post Liddell Shutdown

Energy Market - AEMO _ Liddell Shutdown

On Thursday (25th May 2023) AEMO released their Scheduling Error notification (incident number 54) confirming they had incorrectly scheduled three of the Liddell units into one of their systems, post the Liddell shutdown, which caused price spikes across the NEM and forwards market on the morning of 1st May 2023.

As has been widely documented the last three Liddell units came offline on the 24th of April (Unit 4), 26th April (unit 2) and finally unit 1 on the 28th of April. This should have flowed through to the systems within the AEMO dispatch engines, however due to an error this was not the case, and the market was affected by the error between midnight and midday on the 1st of May 2023.

The error was cause by a mismatch of data used within the systems which feed the NEMDE (NEM Dispatch Engine) used by AEMO, whereby one part of the system removed the units from 00:01 on the 1st May. However, a separate part of the NEMDE’s data feed system, which controls the constraints still included the Liddell units at their “initial values” i.e. 500MW, not their real value of zero.

When the equations within the constraint tried to equalise, there was a “drop” of 1500MW on one side of the equation from the first interval on the 1st May 2023.

To rectify this AEMO reduced flow coming from Victoria into NSW and around 173MW of generation was dispatched down.

Prices reacted as expected with 6 periods between midnight and 6am having prices between $2,771.58/MWh and $2,964.04/MWh and increasing the daily average price by around 30% to an average of $288.86.

With a marketplace reacting to every cough of a power station, especially in the days following the Liddell closure the added constraint was enough to also strengthen the forwards market with the Q323 close price rising $5.50/MWh on the day in comparison to the day before across QLD, Vic and NSW and even SA was affected with an $8/MWh increase on the previous days close.

This strength continued into the next few weeks as outages came into the mix, a tube leak delaying the return to service of Bayswater 2 to the 3rd May, Kogan Creek, Eraring 2 and Tarong taking outages, the return of Callide being delayed and an unexpected interest rate hikes putting additional pressure on the market. Speculators were quick to act trading the spread between states thus increasing prices across the NEM.

This reactionary sentiment is one we feel will remain for a while, with the spot market quickly correcting however the futures continue to hold value down the curve.

Renewable energy storage road map released

Edge 2020 Brisbane City

The CSIRO released its Renewable Energy Storage Roadmap at the end of March 2023.

Their modelling suggested that while Australia leads the world in solar generation, and we have reduced emissions significantly, there is still a big task ahead of the country if we are to meet net zero emission targets and maintain affordable and reliable energy to end users. The CSIRO Renewable Energy Storage Roadmap report showed Australia will need significant amounts of storage to meet the transition to renewables.

Storage is the key to integrating renewable energy into the grid and reducing the dependency on coal and gas fired generation. Currently the electricity produced from renewable sources such as wind and solar is intermittent and is not easily dispatched into the grid when it is most needed. Storage allows the renewable energy to be generated when the natural resources are high and dispatching it into the grid when the electricity is needed.

Dispatchable storage is currently available in the grid in the form of pump storage hydro, such as Wivenhoe power station in Queensland and Tumut 3 in NSW. There are also various battery installations located across the NEM.

The dispatch of renewable energy may require different storage technologies to best suit an evolving NEM. Storage comes in various forms from electrochemical storage such as batteries, mechanical storage such as hydro, chemical storage and thermal storage. Each technology has its pros and cons, but a combination of technologies is likely to be required to meet the real time storage volumes and timings of the NEM.

For many years pumped hydro has been seen by governments as the solution to Australia’s energy storage needs, but timing is the limiting factor in this solution.

To enable the transition from coal and gas fired generation to renewables, storage is required now. On a typical day we have excess solar generation resulting in negative spot prices, however over the evening peak as demand increases the supply of renewable drops of coal and gas provide the generation to meet demand. Thermal generation is normally dispatched at prices higher than the cost of renewables resulting in higher spot prices. If storage could be used efficiently the solar energy produced during daylight hours could be used over the evening peak and into the evening resulting in lower electricity prices.

As coal fired generation retires between 2023 and 2035, new dispatchable generation needs to be brought online, the CSIRO report states, development timelines need to be accelerated to bring more projects online by 2030.

Pump storage hydro typically has a lead time of 10 years so either development timelines need to be accelerated or different storage technologies need to be employed in the meantime.

CSIRO chief executive said “there was a need for a “massive increase” in storage capacity to achieve the transition to net zero, with estimates of 11 to 14 gigawatts of additional storage capacity by 2030 alone.

2030 is not far away, to meet the transition targets should industry be focusing on storage rather than generation? Is storage an opportunity to utilise existing infrastructure like old mine pits for pump storage hydro or repurpose retiring thermal power station sites as storage hubs?

Future investment in the grid not the cheapest option

At the end of February, Energy Ministers agreed to go down the path of a voluntary congestion relief market with priority access. Most developers and advocates of renewable energy have supported the energy minister’s decision to proceed with planning for a congestion relief market, but Australian Energy Market Operator (AEMO) have released initial costings showed it could cost more than $300M.

Previously the Energy Security Board (ESB) proposed a connection fee model, the voluntary congestion relief model has been estimated to cost up to 30 times more than the connection fee model.

The new ESB boss and current chair of the rule maker, the Australian Energy Market Commission (AEMC), recently said “the more expensive voluntary model chosen to help fix transmission congestion on the grid from the influx of renewables will ultimately deliver more benefits for consumers and result in fewer carbon emissions”.

The NEM is controlled by the National Electricity Market’s dispatch engine (NEMDE), this computer system dispatches all the scheduled units across the NEM and optimises across all inputs including bid prices, constraints, supply, and demand. This is an aging system and would require replacement to operate the ESB’s proposed connection fee model.

The Australian Financial Review revealed the congestion model would cost $76M, much higher than the $19M congestion model initially preferred by the ESB, however there are cost savings in not replacing NEMDE.

The ESB’s cost-benefit analysis of the capacity relief market would result in a net benefit of between $2.1B and $5.9B over 20 years. Apart from the economic benefits the model would reduce emissions by 23Mt over the 20 years.

Transmission congestion has increased over the last 5 to 10 years as more renewable and storage projects connect to the existing network. The market operator AEMO has been highlighting the need for new network capacity to accommodate the 127GW of renewable energy expected to enter the grid by 2050 in various planning publications. While renewable energy will displace the majority of coal and gas generation an extra 63GW of transmission capacity are still needed to facilitate the 127GW of renewables and storage likely to connect to the grid.

Under the current market rules generation from new projects can curtail the output of existing power station resulting in existing projects exporting less power. While this model works well for system security it does not work well for developing an industry and providing certainty for developers.

The ESB’s preferred option of voluntary congestion would allow developers to trade congestion relief with priority given to existing projects over new projects when accessing the grid during times congestion.

The final model will be delivered to the energy ministers by mid-2023 and is likely to be in place in 2027.

Despite being the best solution over the long-term existing energy users will pay the cost in the short term.

 Edge2020 have an eye on the energy market, enabling us to support price  benefits as well as customer supply and demand agreements. Our clients rely on our experts to ensure they are informed, equipped, and ideally positioned to make the right decisions at the right time. If you could benefit from an expert eye on your energy portfolio, we’d love to meet you. Contact us on: 1800 334 336 or email: info@edge2020.com.au


Slow growth in renewable energy

The Clean Energy Council (CEC) recently released to its members their quarterly renewable projects report, which showed only one renewable project, Stubbo solar farm, reached financial close in Q3-2022. The 400MW Stubbo solar farm situated in NSW demonstrates the slowing of the renewable industry. Renewable project growth has slowed by almost 30% compared to Q2 -2022 and over 60% slower than Q3 -2021.

While politicians are talking up the prospects of a renewable energy driven industry to reduce the impact of climate change, the reality reaching the 44GW target outlined by the federal government may be hard to achieve at the current rate of growth. To meet the 44GW target by 2030, a significant number of new wind, solar and storage projects need to come online. If these projects do not happen, the retiring coal generators cannot be replaced and may be forced to remain online.

The CEC says investment in renewable is at an all-time low. Quarterly investment has dropped almost 60% to $418M.

As well as the federal announcements, QLD and VIC have also announced ambitious renewable targets linked to the transition from coal fired generation.

Recently the Federal Minster for Climate Change and Energy estimated Australia must install 22,000 500-watt solar panels every day for eight years, along with 40 seven-megawatt wind turbines every month, backed by at least 10,000 kilometres of additional transmission lines to meet its commitment to reduce emissions by 43 per cent by 2030. This is what is required for us to reach a target of 82% renewables by 2030.

While only one project reached financial close last quarter, three projects started construction during Q3-2022 with an increase of installed capacity of 902MW. As well as another two projects that completed commissioning during Q3-2022.

The Stubbo solar farm project also included a storage device, being the only storage device to reach financial close.

Currently, there are 247 financially committed renewable projects in Australia, with 221 under construction and 169 undergoing commissioning.

The CEC notes that the desire to build new solar, wind, pumped hydro, and transmission lines are meeting opposition from local communities. For example, projects like the Chalumbin wind farm, situated next to World Heritage-listed rainforests in North Queensland are reducing the number of wind turbines they are installing by half due to the concerns from the local community. Another example being part of the Queensland government’s renewable plan which included the construction of the largest pump storage hydro station near Mackay. Mackay locals later found out one of their towns has the potential to be flooded as part of the mega project.

With ambitious renewable targets being spruced by politicians and businesses actively seeking renewable energy to aid in the decarbonisation of their operations, the question of where and when these projects will be delivered needs to be asked. The majority of people support the transition to renewables but obviously not in their backyard.


Market Report – Quarter 3 2022

Overview of National Electricity Market (NEM) Quarter 3 2022

International drivers continue to increase gas and electricity prices across the NEM. The main reason for this increase has been and continues to be the tight supply / demand balance resulting from Gas flow restriction in Europe, associated with the war in Ukraine. The reduced flow of gas in Europe has resulted in a greater demand for Australian gas that in turn has put cost pressures on Australian gas market. Higher priced gas then links into to Australian electricity market, leading to higher spot and futures electricity prices.

For Q322 electricity spot prices averaged $216/MWh across the (NEM). The Q322 average spot price of electricity was close to matching the all time record of $264/MWh that occurred in Q222. Interestingly, the average price of electricity for Q322 was more than three times higher than the same quarter the previous year. In Q321the average price of electricity was $58/MWh.

NEM operational demand increased by 2.6% or 559MW to 22,414 MW compared with the same quarter last year. We also saw demand increase for the first time in Q3 since 2015. Households and businesses used more electricity from the grid as a result of their underlying electricity consumption increasing and the output from their rooftop Photovoltaic systems (PV) not generating as much as normal due to cloudy conditions.

High spot prices occurred at the start of Q322 on the back of record high spot prices seen across Q222. The July NEM monthly average of $360/MWh was $23/MWh higher than the June 2022 average of $337/MWh. Later on in the quarter spot prices fell with August Electricity prices averaging $145/MWh across the NEM. Until this year QLD, NSW, VIC and TAS have not recorded a Q3 average electricity price of over $100/MWh. South Australia reached this milestone in Q316 at $119/MWh.

Historically Q3 is not a volatile quarter, but this year it is different, Q322 saw 24% of the dispatch intervals with a price over $300/MWh. This is on the back of the previous quarter, in July prices exceeded $300/MWh 61% of the time, the highest monthly proportion since  the start of NEM. Many intervals saw prices in the $300-$500/MWh range resulting in spot prices moving above the historical price cap threshold of $300/MWh.

Below are the drivers that elevated spot prices and volatility in Q322.

  • A reliance on thermal generation (coal and gas fired) with higher fuel cost due to the increased demand for these resources internationally.
  • Hydro generation setting prices at elevated levels due to limited water supply and bids adjusted to meet revised trading strategies.
  • An increase in demand as consumption increased and rooftop PV generation reduced due to cloudy skies.
  • Price volatility significantly increased the average spot price of electricity with large jumps in spot price due to the distribution of generation offers within the bid stack. The market operator stacks all offers from lowest to highest to build the bid stack. The spot price for a trading interval is the offer price of the marginal unit at the required generation level to meet demand. The bid stack ranges from -$1,000 to $15,500/MWh. During August the spot price reached over $1,000/MWh as generators withdrew generation for technical and economic reasons.
  • With higher average electricity prices we also saw less negative electricity prices across the NEM. In the previous year we experienced negative prices 17% of the time but for Q3 we have only experienced negative prices 9% of the time.

Weather

A La Niña event was declared across the NEM increasing the likelihood of above average winter-spring rainfall across much of northern and eastern Australia, while a negative Indian Ocean Dipole (IOD) event increased the likelihood of rainfall across southern and eastern Australia. Q322 was very wet, with many sites recording their wettest July on record. Wet weather continued across Q3 with September’s rainfall being the fifth highest on record across Australia. Temperatures at the beginning of the quarter were below average in many parts of Victoria and Tasmania and above average minimum temperatures occurred across south-east Australia.

La Niña resulted in wet and cloudy conditions impacting solar generation and the supply of coal to power stations, in additon to the export market resulting in higher prices.

Electricity Demand

As outlined above the NEM demand has changed since the same time last year, the below chart shows this graphically.


The chart below shows how the demand in Q3 has increased in recent years.


The charts below also show the slow down in the growth on rooftop PV and change in operational demand.


NEM Spot Prices

NEM spot prices have increased significantly and have reached unprecedented levels.

The cost of the underlying fuels for generators has led to these increases. Coal and gas prices are at all time highs due to international demands leading to a high cost of generation. The chart shows the correlation between East coast gas price and the price of electricity. Coal also corelated closely to the cost of generation and a resulting electricity spot price.

Prices have also increased as renewables generation (solar, wind and hydro) is lower due to cloud cover reducing solar, low storage levels reducing hydro generation and hence it bids in at higher prices. There have also been large swings in the output from wind which results in spot market volatility.


Generation and Offer Prices

Gas contributed the most to supply in Q322 and as result of the high cost of gas this has influenced the average spot price.The lower volume of generation from coal was a result of bidding behaviour withdrawing thermal capacity and intermittent generation like solar and wind taking a larger market share.

A lower capacity factor for coal generation has resulted in coal fired availability moving higher up the bid stack resulting in coal fired generation needing to dispatch at higher spot prices to meet their long run average costs.


Emissions

NEM emissions intensities declined this quarter slightly to 0.6 tCO2-e/MWh. Total emissions were 0.2% lower than Q321.

Australian Stock Exchange (ASX)

The futures market was influenced by a higher spot market, gas prices and the delays experienced with large scale renewables, a slowing in the rooftop PV market and climate conditions likely to reduce the output from solar generation.

The future price of electricity traded on the ASX for Calendar 2023 (Cal 23) continued to increase in price across the quarter in the four NEM mainland regions. Cal 23 New South Wales futures finished the quarter at $232/MWh, with Queensland at $224/MWh, South Australia at $193/MWh and Victoria at $157/MWh.


Credits: All charts in this report are sourced from AEMO


Edge 2020 offer market leading services for business energy users who require a resource they can trust. We help you navigate the ever-changing energy landscape and ensure the proactive and accurate delivery of advisory, account, and portfolio management services and associated outcomes. Reach out, we would love to assist you: info@edge2020.com.au or call on:1800 334 336


Green hydrogen

Green hydrogen

In the brightest day and the blackest night, no opportunity shall escape my sight.

Ok, bar the bad Green Lantern pun, Green Hydrogen is the superpower on everyone’s lips at the moment. From the USA releasing its draft National Clean Hydrogen Strategy and Roadmap a few weeks ago, to the announced changes in the Hydrogen regulation in Europe, even Queensland has jumped on the press release bandwagon, announcing it as a cornerstone within its new Jobs and Energy Plan.

But what is this superpower? How can it help and what does it really do?

Well let’s start at the beginning, what is Green Hydrogen, why is it different to Grey or Blue Hydrogen and why is that important?

Green Hydrogen is produced by electrolysis, by splitting water into its base elements of Hydrogen and Oxygen. The reason it is Green is this process is done using renewable energy. The most preferred approach is to have this PPA (green energy) onsite and therefore Behind the Meter, however it is equally classified, at the moment, from other sources, with both the PPA and electrolyser being grid connected. Noting that there are additional costs if this is not co-located BTM generation as Network costs come into play.

The differential between this and Grey and Blue Hydrogen isn’t the process, but the fuel used to power the electrolysis. Grey Hydrogen comes from Natural Gas and Blue is from Gas but that is coupled with Carbon Capture and Storage (a technology which has been the silver bullet since I was at Uni and despite millions being pumped into the technology remains uneconomic and therefore unused).

Why is this important – well to truly move towards a clean energy future, and for Hydrogen to play a large part in that, the technology used to create the hydrogen must be green, otherwise the end product (the hydrogen) is just an energy transition of the non-renewable source which was used to create it. This is why the Europeans (CertifHy) amongst others, will only allow Green Hydrogen certification from real PPA sources, not greenwashed with carbon credits, and certainly not from any other forms of electricity.

So how can the green hydrogen transform our supply? Well ignoring other uses of the fuel and export at the moment, transportation being a key area which could benefit as their fuel is hard to abate without a viable alternative as well as Ammonia and Methanol production. There is the obvious use if the fuel can be used for power supply.

This is moving closer with the planned Tallawarra B 200MW dual fuel power station (natural gas and green Hydrogen) due online in the summer of 2023/ 24. If this technology can be proven, this will be a huge source of clean energy which can be used for grid stability and baseload generation, it could also remove any bumps from the transition away from coal.

To give a sense of scale though 1KG of hydrogen is equivalent to about 33.3KWh of electricity. Last year the NEM supplied around 204TWh of electricity, so we would require around 6.2million tonnes (or 6.2billion KG) of Hydrogen to power the NEM.

Now the part to blow your noodle, to produce that 1Kg of Hydrogen we need to put into the electrolyser around 50KWh of electricity (taking a 67% efficiency rate for an Alkaline or PEM electrolyser, noting Solid Oxide electrolysers can have higher efficiencies.) Using this 67% efficiency rate we need to put in 310TWh of electricity to be able to produce the 240TWh required for the NEM. This is without factoring that Hydrogen which can be used for transportation and that which will be exported (with Japan underpinning many domestic projects how much will be available in Australia initially? But I said I wouldn’t be diverted to this today!).

This means the Hydrogen power industry alone has the capability to more than double the capacity requirements of the NEM. However, this requirement and thirst for power could be its real secret superpower.

Network constraints are the words every solar and wind operator hates, the renewable energy is being produced but either cannot be transported to the load centres or cannot be used in the local distribution zone and as such is wasted. Although the Hydrogen industry may not be able to use all this excess volume, especially in the near term, it certainly can absorb a large amount of it. Thus, reducing curtailment and increasing the renewable penetration to the grid.

But that isn’t its only superpower to assist with the balance of the grid, cast your mind back to this winter with curtailment being requested from every corner of the NEM. Rather than being the off-taker, the electrolysers can provide demand side management. They will naturally be programmed to react to the price and renewable energy generation signals anyway to be efficient. Therefore, turning up and down at these strained periods without needing market intervention will be a benefit we have not previously been able to tap into.

Hydrogen certainly looks to be the silver bullet this industry has been craving, and no one wants to be left behind when this train leaves the station. However, with so much in theory and nothing as yet proven to scale, we all hope that it doesn’t turn out to be the Aquaman of the superhero world.

Edge2020 provides energy management and advisory services to buyers and sellers of physical and financial energy products. We specialise in electricity, gas, renewable, environmental, and carbon products. Edge2020 can help ensure you achieve your business sustainability goals by supporting you with strategies that focus on minimising consumption and responsible purchasing of renewable energy. Reach out to our passionate team for support to improve your sustainability outcomes – email: info@edge2020.com.au 


Coal state leading the way to renewables

Last week in Queensland the weather was perfect. It was perfect for those at the beach during school holidays but also perfect for renewable energy.

As everyone in the NEM knows, Queensland is better known for its dominant coal generation, at times pumping out 80% of Queensland’s power supply. With the clear skies and just enough wind, Queensland became the renewable state.

Last week, Queensland’s demand was supplied by over 66% renewable energy. Solar was the largest contributor of renewable energy with wind coming in second.

Previously we have seen the state powered by 50% renewables but the 66% hurdle is a positive message for end users impacted by the reliability and behaviour of the thermal generators.

The Palaszczuk government announced their 10-year-energy plan which involved introducing two new pumped hydro mega-projects in regional Queensland and a green conversion of its coal-fired power generators. The Palaszczuk government also has recently announced upping the target of 50% renewable energy by 2030 to 70% by 2032.

Despite this increase in target, until recent years coal has remained dominant in Queensland. The government has all but ruled out the early retirement of any of the state-owned coal-fired power stations, following pressure from unions. Some could say the slow uptake in renewables is due to supply chain issues, registration, connection and construction delays while other may say it results from the government owning a significant portion of the existing thermal and non-thermal generation that is reaping high returns due to the spot and forward energy prices.

AEMO’s recent Integrated System Plan (ISP) shows the NEM will contain over 80% capacity coming from renewables by 2030. While the renewable industry in Queensland has been slow to grow recently more federal funding is being used to rewire the nation by connecting renewable energy zones (REZ) to end users. With the rewiring in place developers are less restricted in building and financing renewable projects and producing renewable energy.

Industry is also looking for renewable energy to meet their sustainability targets which leads to a market for new renewable projects. AEMO indicated there are thousands of MWs of renewable projects waiting to be built.

If Queensland followed the latest ISP, the state would require an additional 30GW of energy from renewable sources and the storage required to make it useful for end users when the sun does not shine, or the wind does not blow.

Today’s announcement by the premier outlined the $62B plan for Queensland energy and jobs. The plan includes:

  • 70% of Queensland’s energy supply from renewables by 2032
  • 80% of Queensland’s energy supply from renewables by 2035
  • Two new pumped hydros at Pioneer/Burdekin and Borumba Dam by 2035
  • A new Queensland SuperGrid connecting solar, wind, battery and hydrogen generators across the State
  • Unlocking 22GW of new renewable capacity – giving Queensland 8 times the current level of renewables
  • Publicly owned coal fired-power stations to convert to clean energy hubs to transition to, for example, hydrogen power, with jobs guarantees for workers
  • Queensland’s publicly-owned coal-fired power stations to stop reliance on burning coal by 2035
  • 100,000 new jobs by 2040, most in regional Queensland
  • 11.5GW of rooftop solar and 6GW of embedded batteries
  • 95% of investment in regional Queensland
  • Building Queensland’s first hydrogen ready gas turbine

With this announcement by the Premier, Edge look forward to more renewable generation entering the market resulting in savings for end users and the planet.

If procuring renewable energy is one of your company goals, Edge2020 can help you build a PPA to support your sustainability strategies. Contact us on 1800 334 336 or info@edge2020.com.au


Market Update – Q3 2022 to date

As we move out of Q2 2022, a quarter that we have never seen behave in this way before, it is interesting to see how things have changed in Q3 to date.

Why was Q2 2022 so controversial? Well, we saw record spot prices, record forward prices, caps put on the gas market, caps put in place in the electricity market, market direction, the activation of Reliability and Emergency Reserve Trader (RERT) and eventually suspension of the National Electricity Market (NEM). As we moved through Q3 has the situation changed?

To make this decision we must first review Q2, to assist us in understanding if things are going to change. What caused all the market intervention in Q2 and the eventual market suspension?

Q2 is normally a quiet time in the NEM, demand is low, and generators take the opportunity to take units offline for routine planned overhauls. The drop in availability that results from the units on overhaul are normally soaked up by the remaining units online. This Q2 we saw a lower than normal number of units online across the NEM to take up this slack, namely Callide C4 that was offline due to the catastrophic failure in May 2021, Swanbank E and thermal generators dispatching less volume due to flooding across NSW and QLD reducing coal supplies.

Q2 2022 saw average spot prices more than double compared with recent years and peaked at the end of the quarter. The average for Q2 2022 reached $332/MWh in Qld, $302/MWh in NSW, SA at $257/MWh and VIC the lowest, at $224/MWh.

Interestingly the quarterly average price for NSW and QLD was above where the Administered Price Cap (APC). The APC is triggered when the sum of the previous 7 days trading intervals equals $1,359,100. The price is then capped at $300/MWh and remains in place at least until the end of the trading day.

Q2 2022 was a quarter of extreme price, low availability, and market interventions. In Queensland for example we saw 42 hours of spot prices below $0/MWh but also 32 hours above $1,000/MWh. While we did not see a significant number of prices reaching the market cap of $15,100/MWh we did see solid prices that increased the average to levels not normally seen in Q2.

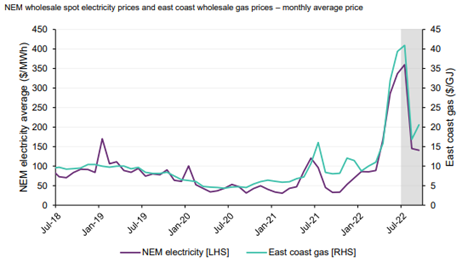
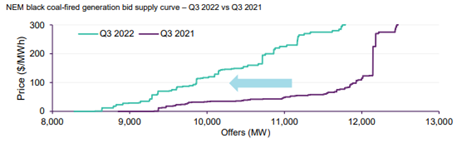
During Q2, exacerbating the issue, we saw significant volume bid in below $0/MWh so units would remain online, however with little between this price and higher prices meant there was a visible gap in the bid stack until prices were over $300/MWh. This distribution was a result of higher fuel cost such as spot gas at $40/GJ which converts to a generation price of over $400/MWh. However, we also saw the emergence of strategic bidding that introduced volatility and higher average prices into the market. The result of the strategic bidding was spot prices for the majority of the time across the NEM were above $100/MWh and often above $300/MWh.

As coal supplies became limited due to flooding, the gas price also jumped due to the global supply issues caused by the war in Ukraine. These fundamentals led to the spot prices increasing and eventually forcing the market operator to cap the market when the Administered Price Cap was reached. APC put a cap of $300/MWh on the electricity spot market.

As a result of the APC, generators removed capacity out of the market rather than operating at a loss due to their higher spot fuel cost. This resulted in the removal of over 3,000MW of generation in which forced AEMO to intervene in the market and direct units online as well as being forced to activate RERT to maintain system security.

Over a few days operating under the APC the market became impractical to operate using directions and AEMO eventually suspended the market on 15 June 2022.

During market suspension AEMO took over the control of the dispatch of market participants units.

Simultaneously during the market suspension, availability returned to the market as units returned from overhauls, coal and gas supply restriction improved and trading strategies were reviewed by the market participants.

On 24 June 2022 AEMO lifted the suspension of the market and the NEM returned to normal operation.

Since the lifting of the market suspension and the commencement of Q3 we have seen a change in some behavior, however spot prices remain high. In the first week of Q3 market participants took advantage of market conditions of low intermittent generation ensuring they benefitted from the ability to increase volatility. In the first week spot price hit the new maximum price cap of $15,500/MWh on several occasions.

While these price spike has lifted the quarterly average for the first 21 days of Q3 to $466/MWh in QLD and $418/MWh in NSW we are seeing this average drop each day.

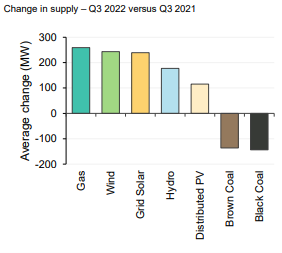
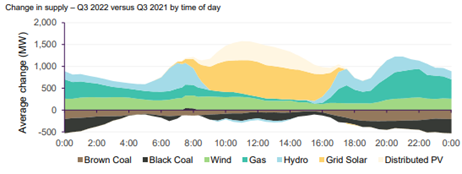
The main driver for the lower spot prices is, as mentioned before, the improved availability across the NEM. Availability in QLD is regularly reaching 9,000MW compared to in June when it dropped 6,600MW. The short-term outlook for generation continues to improve daily with the majority of planned outages now completed.

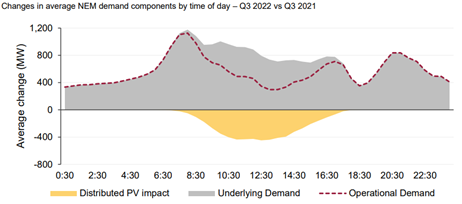
A secondary driver that has pushed down average prices is the return of the sun. Solar generation is now regularly pushing the spot price below $100/MWh and on some occasions back into negative territory.

Less volatility in the spot market has been reflected in the forward market with Q422 QLD dropping from over $270/MWh in June to $260/MWh and the Q123 product dropping below $250/MWh.

Without delving into the gas supply concerns in Victoria, all other states have removed the price cap on gas allowing the market to operate more efficiently. This has not resulted in the gas market trading at significantly high prices as feared, Qld is $42.75/GJ, NSW is $51.51/GJ and SA at $45.51, translating into a sub $500/MWh peaking gas plant cost of generation.

As the weather warms up and the daylight hours increase, we expect to see a drop in demand, with heating loads reducing coupled with an increase in the generation provided by solar.

All of this, as well as increased thermal generator availability and stability in the gas markets, should see spot and forward prices continue to fall across the quarter.