Carbon Border Adjustment Mechanism gaining traction in Europe

Edge2020_Carbon Border Adjustment Mechanism

The European Parliament is introducing new climate legislation including a Carbon Border Adjustment Mechanism, in a bid to reduce greenhouse gas emissions.

The new package aims to reduce emission by at least 55% by 2030 and will include a series of measures which will have big impacts to many large industry customers who now will have millions of tonnes of carbon at risk.

The proposal will include phasing out of the free European Emission Trading Scheme (ETS) allowances after 2026, including maritime shipping within the ETS and a Carbon Border Adjustment Mechanism. The latter of these the CBAM or Carbon Border Adjustment Mechanism will impose a tariff on goods whose production is carbon intensive and shows the greatest risk of carbon leakage, in Australia the most vocal opponents of this scheme are unsurprisingly the cement, aluminium and steel industries.

As a quick digress the term carbon leakage is referring to the idea that you move the most carbon intensive parts of your production abroad, into countries with less stringent climate policies, and then import them back into Australia.

The idea of the CBAM is this will place a price on the carbon which has been emitted during this production phase. The price being derived from the price of carbon which was paid for the product to be developed and produced within Australia.

Those keen eyed amongst us will remember the Safeguard Legislation, which will come into effect on the 1st July 2023, cited a review would be undertaken to examine the feasibility of a CBAM within Australia, including a consideration for early commencement for those high-exposure sectors such as steel and cement.

Now with the EU making the leap and the likely follow on from the UK, Japan and Canada, amongst others, including the US via its own Polluter Import Fees Australia, we will surely have to comply to ensure both our own goods are being protected as well as meeting the requirements of the global expectations.

However, what is the cost of compliance. Whilst the legislation is quite straight forward the compliance cost will increase. Cradle to gate / grave accounting is complex and with auditors being stretched between, NGERs, Safeguard and now this, finding a resource to complete the calculations and data collection will be one thing, but looking to have these accounts audited will be another. With the CER having only 75 registered auditors on their books will the cost of this be wider than the government are imagining?

AEMO adds to the spooking of the Energy Market post Liddell Shutdown

Energy Market - AEMO _ Liddell Shutdown

On Thursday (25th May 2023) AEMO released their Scheduling Error notification (incident number 54) confirming they had incorrectly scheduled three of the Liddell units into one of their systems, post the Liddell shutdown, which caused price spikes across the NEM and forwards market on the morning of 1st May 2023.

As has been widely documented the last three Liddell units came offline on the 24th of April (Unit 4), 26th April (unit 2) and finally unit 1 on the 28th of April. This should have flowed through to the systems within the AEMO dispatch engines, however due to an error this was not the case, and the market was affected by the error between midnight and midday on the 1st of May 2023.

The error was cause by a mismatch of data used within the systems which feed the NEMDE (NEM Dispatch Engine) used by AEMO, whereby one part of the system removed the units from 00:01 on the 1st May. However, a separate part of the NEMDE’s data feed system, which controls the constraints still included the Liddell units at their “initial values” i.e. 500MW, not their real value of zero.

When the equations within the constraint tried to equalise, there was a “drop” of 1500MW on one side of the equation from the first interval on the 1st May 2023.

To rectify this AEMO reduced flow coming from Victoria into NSW and around 173MW of generation was dispatched down.

Prices reacted as expected with 6 periods between midnight and 6am having prices between $2,771.58/MWh and $2,964.04/MWh and increasing the daily average price by around 30% to an average of $288.86.

With a marketplace reacting to every cough of a power station, especially in the days following the Liddell closure the added constraint was enough to also strengthen the forwards market with the Q323 close price rising $5.50/MWh on the day in comparison to the day before across QLD, Vic and NSW and even SA was affected with an $8/MWh increase on the previous days close.

This strength continued into the next few weeks as outages came into the mix, a tube leak delaying the return to service of Bayswater 2 to the 3rd May, Kogan Creek, Eraring 2 and Tarong taking outages, the return of Callide being delayed and an unexpected interest rate hikes putting additional pressure on the market. Speculators were quick to act trading the spread between states thus increasing prices across the NEM.

This reactionary sentiment is one we feel will remain for a while, with the spot market quickly correcting however the futures continue to hold value down the curve.

News from Rewiring The Nation

Australian Power Lines

Over the last week Chris Bowen has been selling from everyone to industry to landowners on the government’s $20 billion “Rewiring the Nation” project. He has stated that “securing social license to build the transmission lines is the single most pressing issue for the Australian energy transition.

The proposal involves the development and construction of 10,000km of lines before 2030 and the key to achieving this will be community and stakeholder relationships, which are now being built into the regulatory investment test (RIT-T) process. To facilitate this the NSW and VIC government are offering $200,000 per km for the land crossed by these new infrastructure projects.

Ian Learmonth, the head of the Clean Energy Finance Corporation, said that Australia will need an estimated 29GW of large-scale renewables to meet our ambitious goals, which breaks down to around 3.6GW a year.

This compares to last year’s large-scale wind and solar where Australia only installed 2.3GW. The 29GW required to be installed is challenged by the slow progress in developing essential new transmission lines and therefore Australia’s targets are at risk.

Daniel Westerman, the Chief Executive of AEMO, has stated that “From our control room we can see that increasing amounts of solar and wind generation are being curtailed because there’s not enough transmission capacity to transport it.”

Despite this, the share of renewables in the grid is hitting new highs, averaging 37% in Q1, and peaking at 66% for a half-hour dispatch period. As a result, greenhouse gas emissions from the grid were at their lowest recorded ever in Q123.

Additionally, there is concern from AEMO that there is 14GW of coal powered generation capacity retiring by 2030, which exceeds the 8GW of renewables announced so far. The effect of this could be starkest in the short term. With Eraring (2,880MW) due to come off in late 2025, there are concerns of a significant short term firming capacity gap for first few summers in NSW.

However, with a new Capacity scheme expected to be announced in the next few months, and the next ESOO due in October expected to show the shortfall for NSW, the possibility of extension is one being seriously discussed.

With the VIC – NSW West Interconnector final drafts expected soon and Humelink approval expected early next year, the move to new transmission is starting. However, questions remain as to whether it is too late for the government to meet its targets.

NSW South West Renewable Energy Zone

Street lights at night

Last Friday, the NSW government released their draft declaration for the South West Renewable Energy Zone (SW REZ) access scheme to the public. This is one of five REZs which have been identified within NSW as part of the NSW governments Electricity Infrastructure Roadmap. The schemes are overseeing the volume of projects which will be granted to the transmission within these zones and co-ordinate the network and generation investments into the areas.

The SW zone is based towards the Victorian border and the proposed connection point would be in the Dinawan Substation. The access standards are very similar to those already proposed in April for the states Central-West Orana (CWO) region.

With the CWO attracting more than $35billion worth of proposed projects the SW REZ is hoping to attract significant investment for its 2.5GW transfer capacity, noting the location will not allow for offshore wind and as much Hydrogen investment as that seen in the CWO.

The NSW government has stated that the aim of the declaration is that “An access scheme provides an opportunity to control the connection of projects to the REZ. In the case of the South West, the proposed access scheme triggers the application of modifications to the National Electricity Rules (NER) open access arrangements as they apply to the access right network.”

The access granted projects will benefit from significant network upgrades including potential upgrades to the Project Energy Connect (PEC) interconnector which is being developed at the moment and is to run between SA (Robertstown) and NSW (Wagga Wagga), upgrades to the HumeLink which would connect that Wagga Wagga substation with Snowy Hydro and its increasing capacity and further strengthen the investment case for the proposed Victoria-NSW interconnector (VNI West). The latter is currently within the RIT-T (Regulatory Investment Test for Transmission) process.

These proposals will surely give investors’ confidence in providing the required project certification to be granted the access to that zone. They must not only show feasibility and prepare to sign onto the standards set out in this proposition, but must ensure they can manage voltage, frequency especially which there are potential disruptions within the system. However, the rewards of participating in a well-funded, transmission rich environment which has certainty of curtailment risk for the access rights holders, are surely going to outweigh the paper-work process of being accepted and given the over subscription of the CWO, you can imagine a similar uptake in this round.

The consultation for the South West Renewable Energy Zone (SW REZ) access scheme is closing on the 15th May 2023.

Next test in NSW for the transition to renewables

Hand turning off light switch

For over eight years, there has been talk of AGL shutting down Liddell power station. Finally, this will become reality today, with the next Liddell unit being shut down.

Liddell Unit 4 will be shut down today, followed by Units 1 and 4 over the next 10 days. The retirement of Liddell power station will make 10% of NSW’s availability being bid unavailable.

It would be expected that the permanent closure of 10% of NSW’s electricity generation would put the grid at risk and lead to higher electricity prices.

AEMO has alleviated market concerns by saying, “Supply is not at risk”. However, Edge2020 is not ruling out an upward pressure on prices due to a shock to the market, despite the market knowing the Liddell units would be shut down for many years.

The retirement of Liddell power station is the next big step for NSW as the state transitions from scheduled coal-fired generation to intermittent renewable energy and storage.

While the market has known about the retirement of the Liddell power station for years, Edge2020 expects the market to be firm on the reality of the closures. Spot electricity and forward prices in NSW and Queensland may increase in the short term; however, they will settle over time.

Following the retirement of the Liddell units, availability will still be relatively high in NSW. The capacity factors of the remaining coal-fired units will increase, and gas will fill the remaining gaps. As a result of this and generation from neighbouring regions, it is unlikely that the NSW region will incur a significant drop in availability resulting in a Lack of Reserve (LOR) notice from AEMO.

AEMO confirmed in February that the closure of the Liddell units would not breach the reliability standard; however, AEMO’s latest reliability report has raised concerns that reliability risks remain in NSW. AEMO’s biggest reliability concern has been the delayed delivery of Snowy Hydro’s Kurri Kurri gas-fired generator. The Kurri Kurri gas-fired generator has been delayed by 12 months. AGL has confirmed AEMO has not approached them regarding reliability levels following the closure.

Further to alleviate the availability and reliability concerns of the market as we approach to summer is the news that Energy Australia will have the 300MW Tallawarra B gas-fired generator online in December. Additionally, NSW imports additional electricity from Queensland and Victoria via the interconnectors.

AGL has plans to repurpose the Liddell site into a clean energy hub which will include a 250MW battery with room for expansion that could be linked to a nearby pumped hydro project.

After the closure of Liddell 4 on April 19th, followed by Unit 2 six days later, and then finally Unit 1 on April 29th, AGL will start demolition in early 2024.

The next few weeks will be an interesting time in the industry, particularly for NSW politics and the wider NEM. Edge2020 will monitor the market and provide updates over the next few weeks as the final unit retires.

Renewable energy storage road map released

Edge 2020 Brisbane City

The CSIRO released its Renewable Energy Storage Roadmap at the end of March 2023.

Their modelling suggested that while Australia leads the world in solar generation, and we have reduced emissions significantly, there is still a big task ahead of the country if we are to meet net zero emission targets and maintain affordable and reliable energy to end users. The CSIRO Renewable Energy Storage Roadmap report showed Australia will need significant amounts of storage to meet the transition to renewables.

Storage is the key to integrating renewable energy into the grid and reducing the dependency on coal and gas fired generation. Currently the electricity produced from renewable sources such as wind and solar is intermittent and is not easily dispatched into the grid when it is most needed. Storage allows the renewable energy to be generated when the natural resources are high and dispatching it into the grid when the electricity is needed.

Dispatchable storage is currently available in the grid in the form of pump storage hydro, such as Wivenhoe power station in Queensland and Tumut 3 in NSW. There are also various battery installations located across the NEM.

The dispatch of renewable energy may require different storage technologies to best suit an evolving NEM. Storage comes in various forms from electrochemical storage such as batteries, mechanical storage such as hydro, chemical storage and thermal storage. Each technology has its pros and cons, but a combination of technologies is likely to be required to meet the real time storage volumes and timings of the NEM.

For many years pumped hydro has been seen by governments as the solution to Australia’s energy storage needs, but timing is the limiting factor in this solution.

To enable the transition from coal and gas fired generation to renewables, storage is required now. On a typical day we have excess solar generation resulting in negative spot prices, however over the evening peak as demand increases the supply of renewable drops of coal and gas provide the generation to meet demand. Thermal generation is normally dispatched at prices higher than the cost of renewables resulting in higher spot prices. If storage could be used efficiently the solar energy produced during daylight hours could be used over the evening peak and into the evening resulting in lower electricity prices.

As coal fired generation retires between 2023 and 2035, new dispatchable generation needs to be brought online, the CSIRO report states, development timelines need to be accelerated to bring more projects online by 2030.

Pump storage hydro typically has a lead time of 10 years so either development timelines need to be accelerated or different storage technologies need to be employed in the meantime.

CSIRO chief executive said “there was a need for a “massive increase” in storage capacity to achieve the transition to net zero, with estimates of 11 to 14 gigawatts of additional storage capacity by 2030 alone.

2030 is not far away, to meet the transition targets should industry be focusing on storage rather than generation? Is storage an opportunity to utilise existing infrastructure like old mine pits for pump storage hydro or repurpose retiring thermal power station sites as storage hubs?

Solar and wind are the big losers in latest AEMO MLF forecasts

woman on a windy day

As the electricity market evolves the Australian Energy Market Operator (AEMO) makes assessments of the changing landscape from a transmission and security of supply perspective.

Recently AEMO released its final assessment of Marginal Loss Factors (MLFs). MLF determine how much energy is lost between the generator and the region reference node in each state.

In this next round of MLFs many of the big losers are the intermittent generators. Changes to the grid and the closure of thermal generators have had a detrimental impact on wind and solar farms. Lower MLF’s impact the amount of revenue generators can make.

The final MLF numbers are not as bad as what was published in AEMO draft report providing some positive news for wind and solar developers. Since the draft report new modelling has included the delayed return to service of the Callide C units.

The primary driver for changes in the new MLF forecasts has been changes in availability due to the closure of Liddell, revised return to service dates for Callide C, revised demand forecasts and the increased penetration of solar and wind generation into the grid.

Recent transmission line work has resulted in an increased capacity between Queensland and NSW which means increased flows from Queensland which results in wind and solar projects located in the north of NSW being constrained.

MLF generally gets worse for generators at the end of a long transmission lines, this has resulted in generation in northern NSW being the big loser this year. Some solar farms in the New England region have dropped by over 3%.

While a 3% fall sounds bad, it is not as bad as the MLF for Moree, a 57MW solar farm in western NSW which loses over 20% of its generation by the time it gets to the regional reference node. Previously Moree solar farm had an MLF of 0.8275, this year it is 0.7977.

The return to service of Callide C significantly impacted solar farms in central Queensland, however the delayed return to service has lessened the impact. Daydream, Collinsville, Kidston, and Moura are some of the solar farms most impacted by the new MLFs.

So what does the mean to end users? While we are seeing a rapid increase in renewable generation, the location of this generation is important to the success of a project. If we use the example of Moree where over 20% of the renewable generation does not reach the market then the question has to be, was it built in the correct part of the grid. Many people focus on the size of the project while the volume of electricity produced needs to be of greater importance. Unfavourable MLF will impact the success of the project, will reduce the renewable energy available to the market and potential can leave end users with less renewable energy than what they had signed up for.

AEMO’s emergency powers prevent blackouts during high peak demand

candle due to blackout

Last Friday demand was forecast to break the all-time record of 10,119MW seen in March 2022. AEMO’s pre dispatch forecasting was showing demand peaking at 10,656MW but by 5:30 it had fallen short with Queensland’s demand peaking at 9,750MW.

With a record peak demand forecast due to high temperatures and humidity, AEMO utilised its emergency powers to prevent blackouts across Queensland. As the evening peak approached on Friday, AEMO intervened in the market and at 4:25pm  they enabled Reliability and Emergency Reserve Trader (RERT).

Between 5.30pm and 9.30pm members of the RERT panel reduced consumption on site or increased on site generation to reduce the overall QLD demand. These panel members are compensated by AEMO under individual arrangements if their services are used.

Prior to the dispatching of RERT, AEMO had sent lack of reserve notices to the market to encourage generators to offer more supply. Also, the QLD energy minister said the system would be tight, but he was confident of avoiding blackouts.

As previously discussed, Queensland relies on wind and solar generation to provide clean cheap electricity, but it is currently reliant on coal fired generation to provide the reliable backup when the sun has gone down, and the wind is not blowing.

Currently on a “normal” day demand is easily filled with a combination of solar, wind, gas and coal but on extreme day like last Friday the system becomes more dependent on scheduled generation like gas and coal fired powered stations.

Following the failure at Callide C3 and Callide C4 the state is down 840MW of availability and on extreme days this generation can mean the difference between “normal” prices and the lights staying on and very high prices and the possibility of load shedding.

If it was not for AEMO stepping in, demand may have increased, and spot prices may have certainly capped out close to $15,500/MWh. While very high prices are not good for end users, they are a signal for investment.

If high spot prices occur, it may encourage increased participation in the market and new generation being built but currently the uptake of renewable projects and storage has been slow.

Queensland has high ambitions to replace the coal fleet with renewable and storage but days like last Friday only reinforce that coal fired generation still plays a significant part in the security and price outcomes in the QLD market.

Edge2020 have an eye on the energy market, enabling us to support price  benefits as well as customer supply and demand agreements. Our clients rely on our experts to ensure they are informed, equipped, and ideally positioned to make the right decisions at the right time. If you could benefit from an expert eye on your energy portfolio, we’d love to meet you. Contact us on: 1800 334 336 or email: info@edge2020.com.au

Electricity price on the way down

Wholesale electricity prices have reduced in recent months however many end users are not seeing the benefits. It is expected the reduction in wholesale electricity prices will not flow onto household and businesses bills until 2024.

Federal treasury has analysed the wholesale electricity market in November 2022 and compared it with the prices we saw in December. Analysis showed wholesale prices dropped but Edge has previously shown renewable energy has not significantly increased, gas supply has not changed, thermal generation has remained unchanged so why the drop in the cost of electricity?

In late December the Federal government stepped into the energy market and intervened, essentially disconnecting the domestic energy market from the international energy market. This intervention put caps on the domestic price of wholesale gas and the price of coal.

Following these caps being put in place the domestic electricity market corrected, and both spot and futures contracts dropped to match an underlying cost of production for electricity based on these new capped fuel prices.

While the wholesale market dropped almost overnight it will take time for the lower costs to flow through to end users unless their load is spot exposed in Q123. Retailers had already locked in the majority of pricing for end users prior to the market dropping due to the intervention, so most end user electricity bills will reflect the historic high wholesale prices.

The federal analysis claims the price caps on coal and gas have dropped prices in QLD by 44% and 38% in NSW. Does this mean electricity bills are going to drop a similar amount? Well, the bad news is no. Retail bills are normally locked in well in advance so many large users have locked in pricing for 2023. The underlying energy costs are only part of the retail bill as other costs include transmission, distribution and AEMO charges which unfortunately have not decreased and have the potential to increase as the market evolves.

While the market intervention was a necessary step to insulate end users from the escalating international energy prices due to the war in Ukraine, the next step is to continue to drive down prices as the country transitions to renewables. We must keep in mind the transition to renewables will come at a cost. Renewable energy requires more transmission lines to connect the generators to the grid, they require specialised services to maintain the security of the grid and will also require a higher cost generation or storage to provide firming for around the clock supply.

While the underlying cost of electricity will drop with more renewable energy entering the market, the other costs on the electricity bill will now represent a higher proportion and are likely to increase.

Edge2020 have an eye on the energy market, enabling us to support price  benefits as well as customer supply and demand agreements. Our clients rely on our experts to ensure they are informed, equipped, and ideally positioned to make the right decisions at the right time. If you could benefit from an expert eye on your energy portfolio, we’d love to meet you. Contact us on: 1800 334 336 or email: info@edge2020.com.au

Market Report – Quarter 3 2022

Overview of National Electricity Market (NEM) Quarter 3 2022

International drivers continue to increase gas and electricity prices across the NEM. The main reason for this increase has been and continues to be the tight supply / demand balance resulting from Gas flow restriction in Europe, associated with the war in Ukraine. The reduced flow of gas in Europe has resulted in a greater demand for Australian gas that in turn has put cost pressures on Australian gas market. Higher priced gas then links into to Australian electricity market, leading to higher spot and futures electricity prices.

For Q322 electricity spot prices averaged $216/MWh across the (NEM). The Q322 average spot price of electricity was close to matching the all time record of $264/MWh that occurred in Q222. Interestingly, the average price of electricity for Q322 was more than three times higher than the same quarter the previous year. In Q321the average price of electricity was $58/MWh.

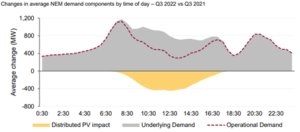
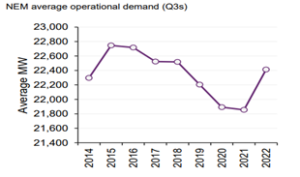
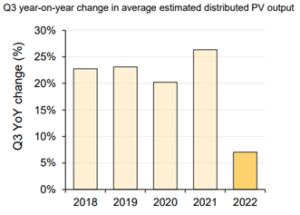
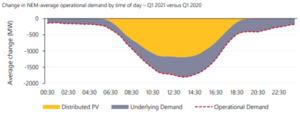
NEM operational demand increased by 2.6% or 559MW to 22,414 MW compared with the same quarter last year. We also saw demand increase for the first time in Q3 since 2015. Households and businesses used more electricity from the grid as a result of their underlying electricity consumption increasing and the output from their rooftop Photovoltaic systems (PV) not generating as much as normal due to cloudy conditions.

High spot prices occurred at the start of Q322 on the back of record high spot prices seen across Q222. The July NEM monthly average of $360/MWh was $23/MWh higher than the June 2022 average of $337/MWh. Later on in the quarter spot prices fell with August Electricity prices averaging $145/MWh across the NEM. Until this year QLD, NSW, VIC and TAS have not recorded a Q3 average electricity price of over $100/MWh. South Australia reached this milestone in Q316 at $119/MWh.

Historically Q3 is not a volatile quarter, but this year it is different, Q322 saw 24% of the dispatch intervals with a price over $300/MWh. This is on the back of the previous quarter, in July prices exceeded $300/MWh 61% of the time, the highest monthly proportion since  the start of NEM. Many intervals saw prices in the $300-$500/MWh range resulting in spot prices moving above the historical price cap threshold of $300/MWh.

Below are the drivers that elevated spot prices and volatility in Q322.

  • A reliance on thermal generation (coal and gas fired) with higher fuel cost due to the increased demand for these resources internationally.
  • Hydro generation setting prices at elevated levels due to limited water supply and bids adjusted to meet revised trading strategies.
  • An increase in demand as consumption increased and rooftop PV generation reduced due to cloudy skies.
  • Price volatility significantly increased the average spot price of electricity with large jumps in spot price due to the distribution of generation offers within the bid stack. The market operator stacks all offers from lowest to highest to build the bid stack. The spot price for a trading interval is the offer price of the marginal unit at the required generation level to meet demand. The bid stack ranges from -$1,000 to $15,500/MWh. During August the spot price reached over $1,000/MWh as generators withdrew generation for technical and economic reasons.
  • With higher average electricity prices we also saw less negative electricity prices across the NEM. In the previous year we experienced negative prices 17% of the time but for Q3 we have only experienced negative prices 9% of the time.

Weather

A La Niña event was declared across the NEM increasing the likelihood of above average winter-spring rainfall across much of northern and eastern Australia, while a negative Indian Ocean Dipole (IOD) event increased the likelihood of rainfall across southern and eastern Australia. Q322 was very wet, with many sites recording their wettest July on record. Wet weather continued across Q3 with September’s rainfall being the fifth highest on record across Australia. Temperatures at the beginning of the quarter were below average in many parts of Victoria and Tasmania and above average minimum temperatures occurred across south-east Australia.

La Niña resulted in wet and cloudy conditions impacting solar generation and the supply of coal to power stations, in additon to the export market resulting in higher prices.

Electricity Demand

As outlined above the NEM demand has changed since the same time last year, the below chart shows this graphically.


The chart below shows how the demand in Q3 has increased in recent years.


The charts below also show the slow down in the growth on rooftop PV and change in operational demand.


NEM Spot Prices

NEM spot prices have increased significantly and have reached unprecedented levels.
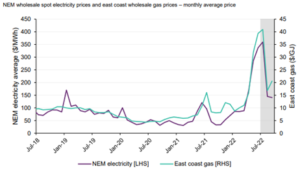
The cost of the underlying fuels for generators has led to these increases. Coal and gas prices are at all time highs due to international demands leading to a high cost of generation. The chart shows the correlation between East coast gas price and the price of electricity. Coal also corelated closely to the cost of generation and a resulting electricity spot price.

Prices have also increased as renewables generation (solar, wind and hydro) is lower due to cloud cover reducing solar, low storage levels reducing hydro generation and hence it bids in at higher prices. There have also been large swings in the output from wind which results in spot market volatility.


Generation and Offer Prices

Gas contributed the most to supply in Q322 and as result of the high cost of gas this has influenced the average spot price.The lower volume of generation from coal was a result of bidding behaviour withdrawing thermal capacity and intermittent generation like solar and wind taking a larger market share.

A lower capacity factor for coal generation has resulted in coal fired availability moving higher up the bid stack resulting in coal fired generation needing to dispatch at higher spot prices to meet their long run average costs.


Emissions

NEM emissions intensities declined this quarter slightly to 0.6 tCO2-e/MWh. Total emissions were 0.2% lower than Q321.

Australian Stock Exchange (ASX)

The futures market was influenced by a higher spot market, gas prices and the delays experienced with large scale renewables, a slowing in the rooftop PV market and climate conditions likely to reduce the output from solar generation.

The future price of electricity traded on the ASX for Calendar 2023 (Cal 23) continued to increase in price across the quarter in the four NEM mainland regions. Cal 23 New South Wales futures finished the quarter at $232/MWh, with Queensland at $224/MWh, South Australia at $193/MWh and Victoria at $157/MWh.


Credits: All charts in this report are sourced from AEMO


Edge 2020 offer market leading services for business energy users who require a resource they can trust. We help you navigate the ever-changing energy landscape and ensure the proactive and accurate delivery of advisory, account, and portfolio management services and associated outcomes. Reach out, we would love to assist you: info@edge2020.com.au or call on:1800 334 336