What is the goal of a capacity electricity market?
You may be forgiven for not sitting through the full press conference last Thursday, where the Albanese government stated Australia would be strengthening their 2030 targets to 43% under the Paris Agreement. However, if you had, around 30 minutes in you would have heard Chris Bowen, the newly appointed Minister for Climate Change and Energy state, “in relation to the short term, State and Territory Ministers agreed with me last week, that we should proceed at haste, at pace, with the capacity mechanism. I asked, on behalf of all Energy Ministers, the Energy Security Board to proceed with that work, at speed, and they are doing that. I am very confident I will be able to get agreement of State and Territory Ministers for a comprehensive capacity mechanism and I’ll have more to say when that work is ready.”
Well that work dropped this morning (20th June) at 7am. They have given those who wish to respond until (25th July) to submit their views on this paper so at pace it shall be. However; given the response following the ESB Post 2025 paper I am not sure that any amount of noise and lobbying from the industry is going to stop this juggernaut from achieving its goal, especially since it is being backed by those generators who have the most to gain from this market. Not only that, but unless there is a big bump in the road, a first look Capacity Mechanism will be in place by 1st July 2025.
What is the goal of this market? – Well in my opinion there is only one reason that this would be encouraged and that is to subsidise coal-fired power stations which have had their financial viability severely questioned by the growing penetration of lower cost renewables within the system. Don’t get me wrong, the longer-term markets have the potential to encourage other faster starting generators onto the market, but this hasn’t really been the case in other capacity markets i.e. Great Britain (GB).
This argument is only further strengthened when looking at how the GB Market ended up achieving their stability, in their high renewable penetrated market, which is from nuclear power which has been guaranteed a strike price of £92.50/MWH or ~$163/MWh. Thus, making any capacity market payment minuscule in comparison to the underpinning of the generation at that rate.
The ESB are arguing, and convincing themselves and the government in the process, that this mechanism is the answer to AEMO’s ISP step change scenario, in which demand increases and coal exits the system. If that is indeed their argument, then they are ultimately stating they cannot efficiently run a system in which coal is not part of the generation mix and unless this is financially managed there will be a ‘disorderly transition.’
The question therefore isn’t will there be a capacity mechanism from July 25, but how centralised or decentralised will the final design be? Will it sit as a Physical Retailer Reliability Obligation – PRRO design, one in which the market determines for itself the level of the required capacity, or do we go wholly down the regulated route with AEMO determining in long term auctions (similar to the GB model which has several T-year auctions) and they forecast demand and supply to determine the required level of capacity and sell these capacity certificates to retailers to meet their requirements.
There is no grey area for the ESB, they have stated openly in the paper they wish for the forecasting and determination of the capacity requirements to be centralised and for AEMO to manage these purchases on behalf of market participants. In essence they would moderate the capacity of these generators, for a cost, at certain times of day or periods of high system stress to allow them to ensure capacity is available to the market operator when needed. End users would then pay for that management of the system and their portion of that capacity.
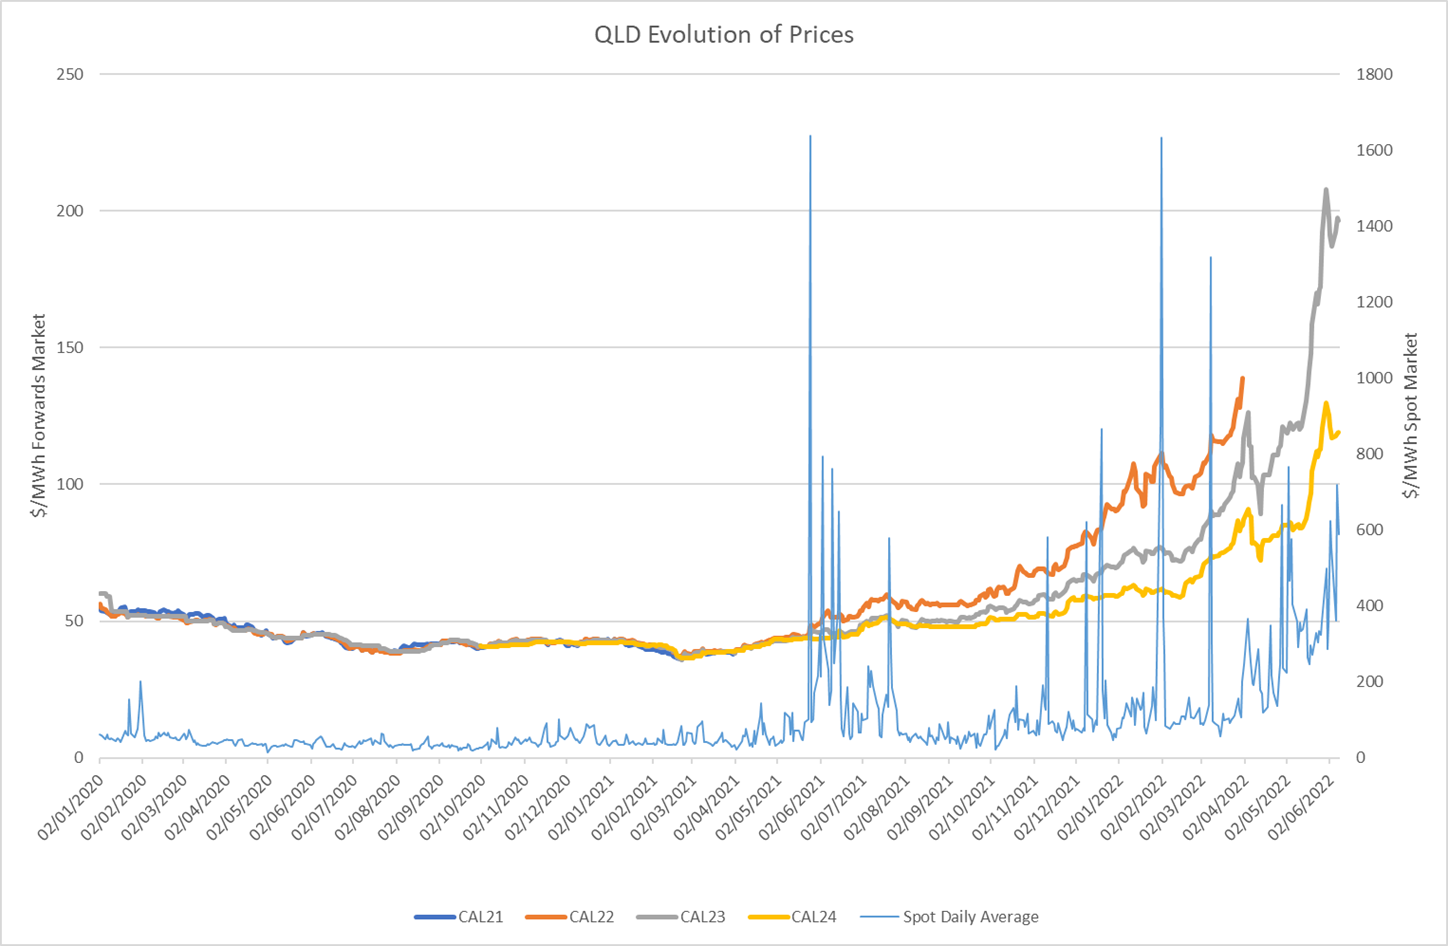
The other point to note, keenly hidden within the paper is the four yearly review of the Reliability Standard and Settings Review (RSSR) that is about to be undertaken, with significant interest been taken in the Market Cap, especially given the gas price cap is equating to a marginal cost of generation higher than the electricity price cap (Presuming a normal heat rate of 8-12). If the caps are risen for both the caps $300/MWh and spot $15,100/MWh markets as expected, could the requirement of ‘capacity’ in the market become a moot point? Surely the exacerbation of the current situation could be avoided if the gas generators were certain of meeting the cost of generation and you cannot truly believe that a market cannot efficiently run with enough capacity if they are achieving $15,100/MWh or possibly more?
The real key argument which has not been addressed by the paper however, is the idea that aging coal plants are unlikely to be able to ramp in time to fill the gaps between this growing renewable penetration. Therefore, the question really needs to be asked is this the right investment if you really want to transition this grid or should this be put into different technology rather than prolonging the life of unsuitable assets?
Ultimately however the bottom line remains ‘user pays.’ As such any one of the options being floated will be passed through to end users through retailer or network tariffs.
I will let the retailers and generators pick apart the nuances of the paper, but needless to say the government will be pushing ahead with this in some form, the only question will be how much say we will have in the centralisation of the market or not, and therefore how much control retailers will have on the costs of this capacity.
Written by Kate Turner, Senior Manager – Markets, Analytics, and Sustainability